PnL Details
The PnL Details page provides comprehensive analytics of the broker's profits and losses (PnL) within the current trading session. The page allows for a detailed analysis of financial results broken down by account groups, trading instruments, and trade sources, using a convenient combination of visual charts and tabular data.
Filters and Controls
A control panel is located at the top of the page, allowing you to customize the displayed data:
- Search (Quick search): A search bar to filter data by keywords.
- Trade servers: A dropdown list to select a specific trading server. By default, it is set to Any server.
- Widget Visibility Toggles:
- PnL by Account Groups — toggles the block containing data by account groups.
- PnL by Symbol Groups — toggles the block containing data by symbol groups (instruments).
- PnL by Trade Reasons — toggles the block containing data by trade sources.
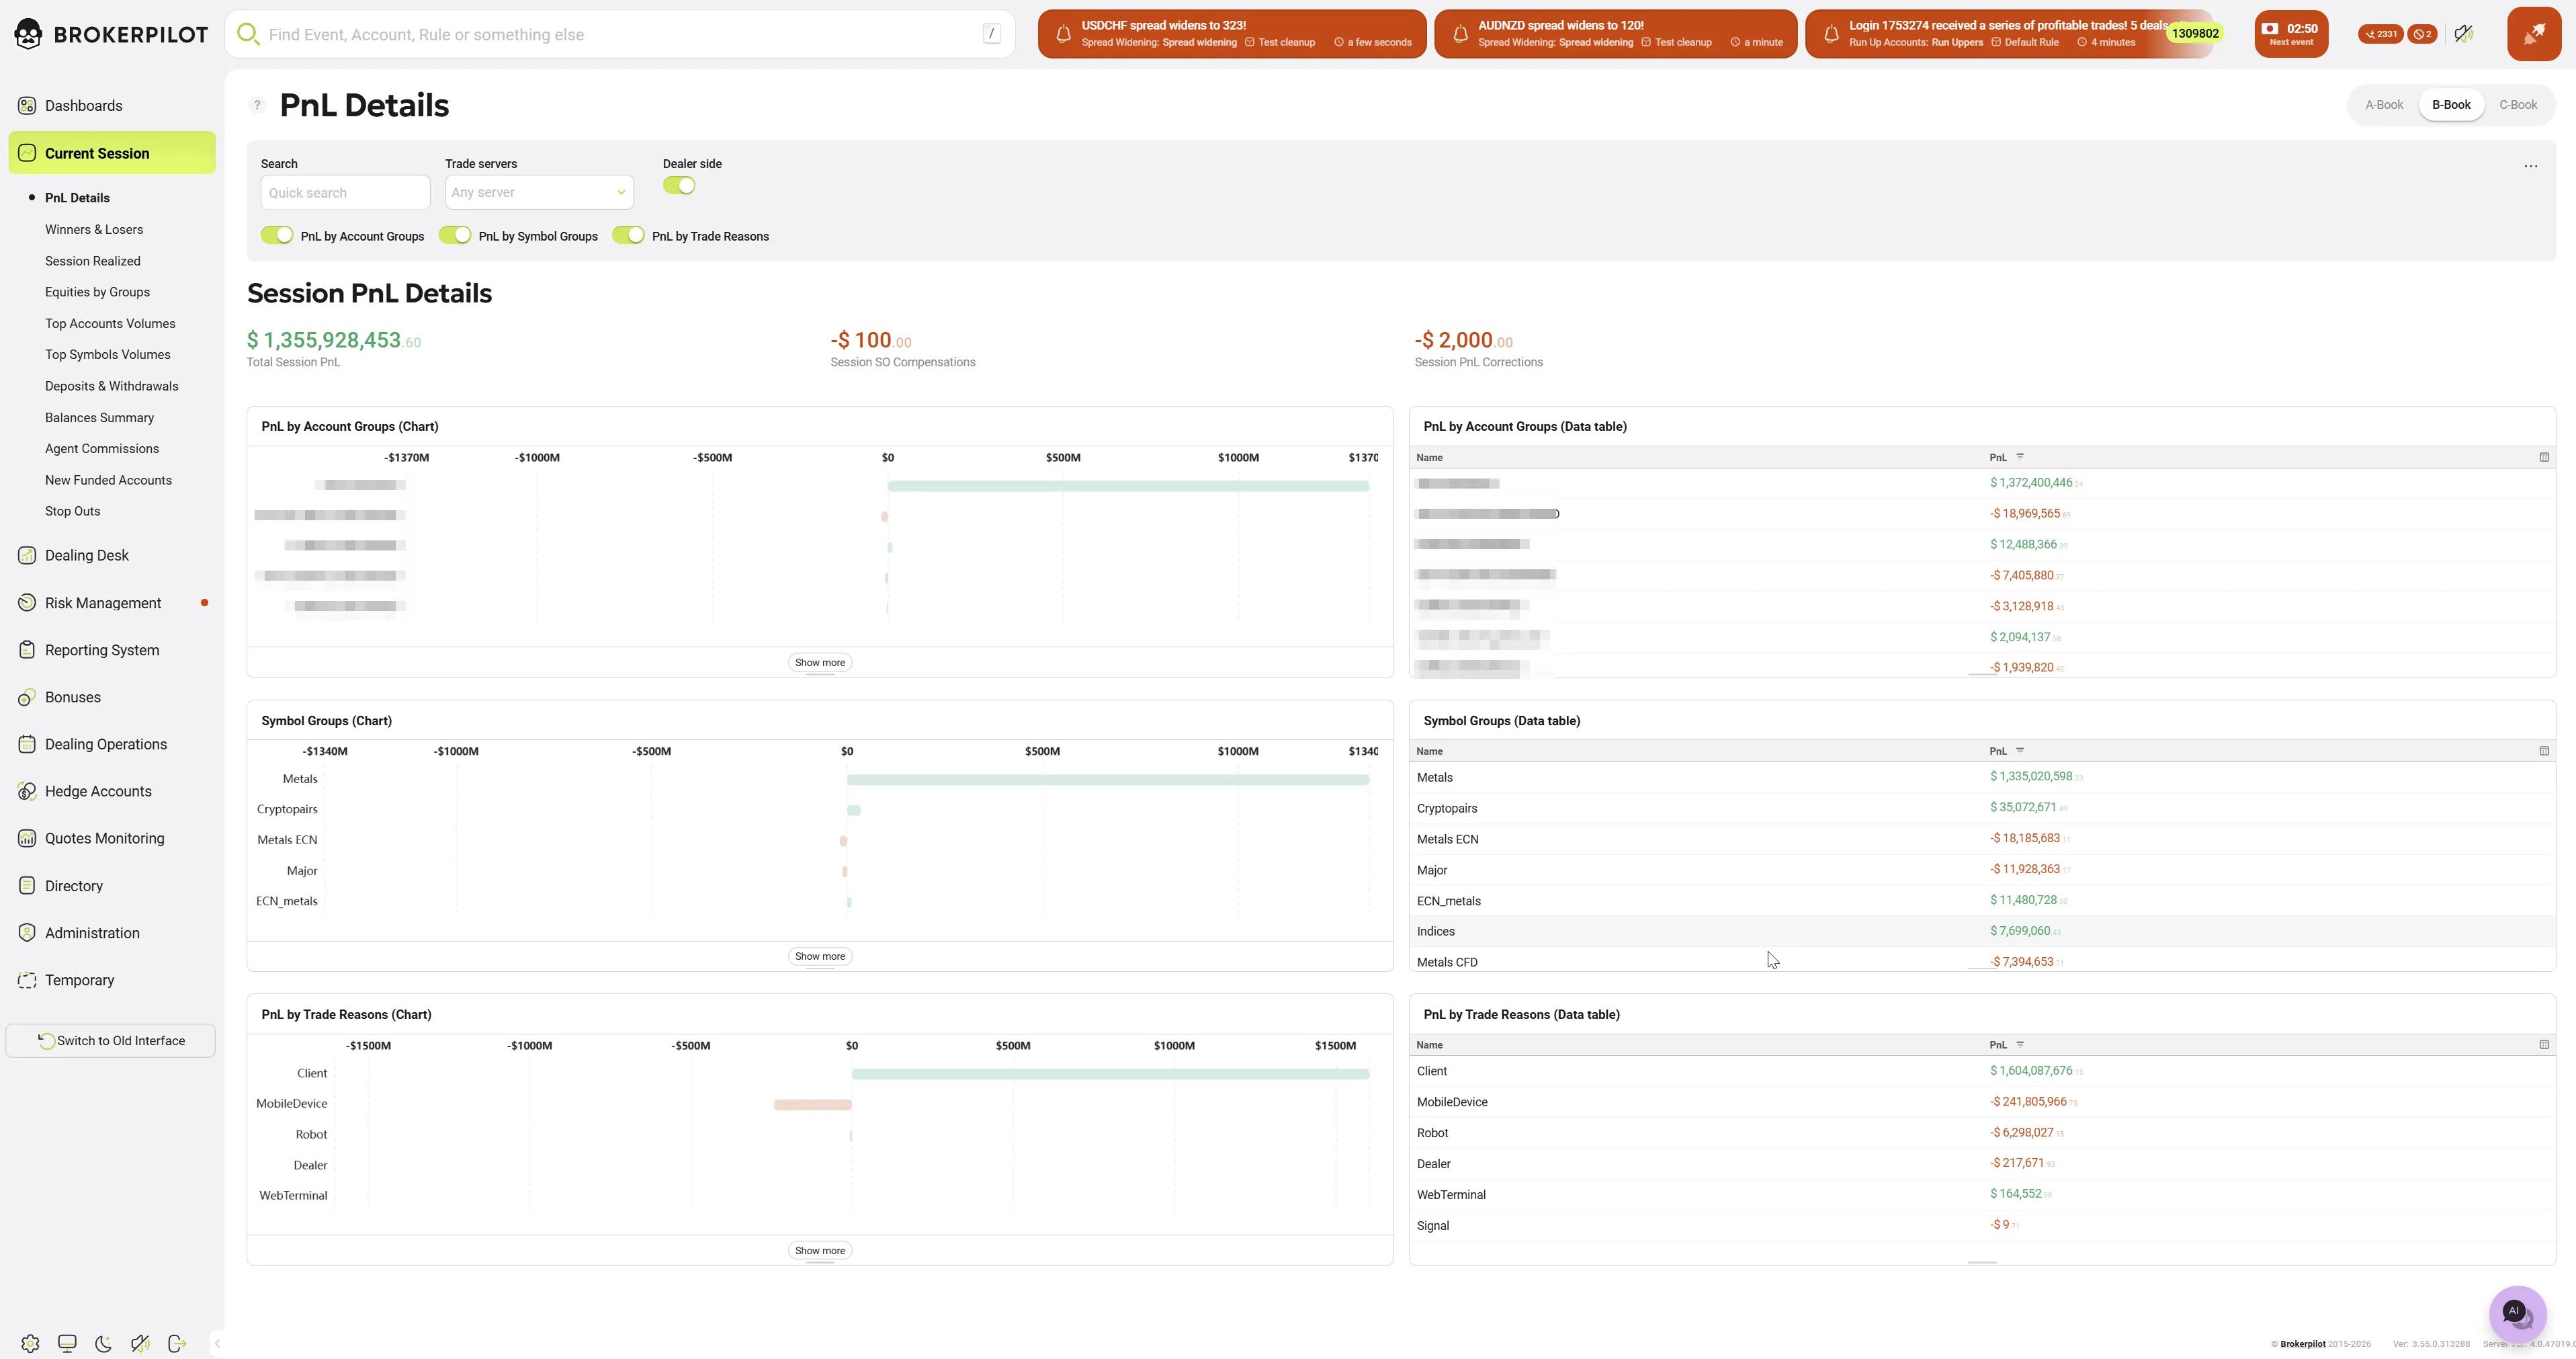
Session PnL Details (Summary Metrics)
Below the control panel, the main financial metrics of the current session are displayed:
- Total Session PnL: The overall financial result (aggregate profit or loss) for the current session.
- Session SD Compensations: The total amount of credits/debits (Compensations) applied during the session.
- Session PnL Corrections: The total amount of PnL adjustments (Corrections) applied during the session.
Detail Blocks (Charts and Data Tables)
The main workspace is divided into two columns for easy data comparison. The left column displays horizontal bar Charts, allowing for a quick visual assessment of the ratio between profitable and losing segments. The right column contains Data tables with precise numerical values.
The page includes three main sections:
- PnL by Account Groups Displays the PnL distribution across various client group types (e.g., demoStandard, demoECN, CONNOISSEUR, etc.). This helps identify groups with the highest profitability or drawdown.
- PnL by Symbol Groups Shows financial results broken down by trading instrument groups, such as Metals, Cryptocoins, Major, Indices, and others. This helps in understanding which asset classes are driving the PnL in the current session.
- PnL by Trade Reasons Groups PnL data based on how or through which interface the trade was executed (e.g., Client, MobileDevice, Robot, Dealer, WebTerminal, Signal). This is a vital tool for analyzing the performance of algorithmic trading (Robot) versus manual trading.
Note: If the number of items in a category exceeds the widget's visible area, click the Show more button at the bottom of the block to expand the full list.