Series of Bad Rates
General Information
The Series of Bad Rates trigger detects a series of oppositely directed price movements that may indicate a technical issue on the Liquidity Provider (LP) side. When such events occur, the trigger notifies a dealer accordingly.
Menu Navigation
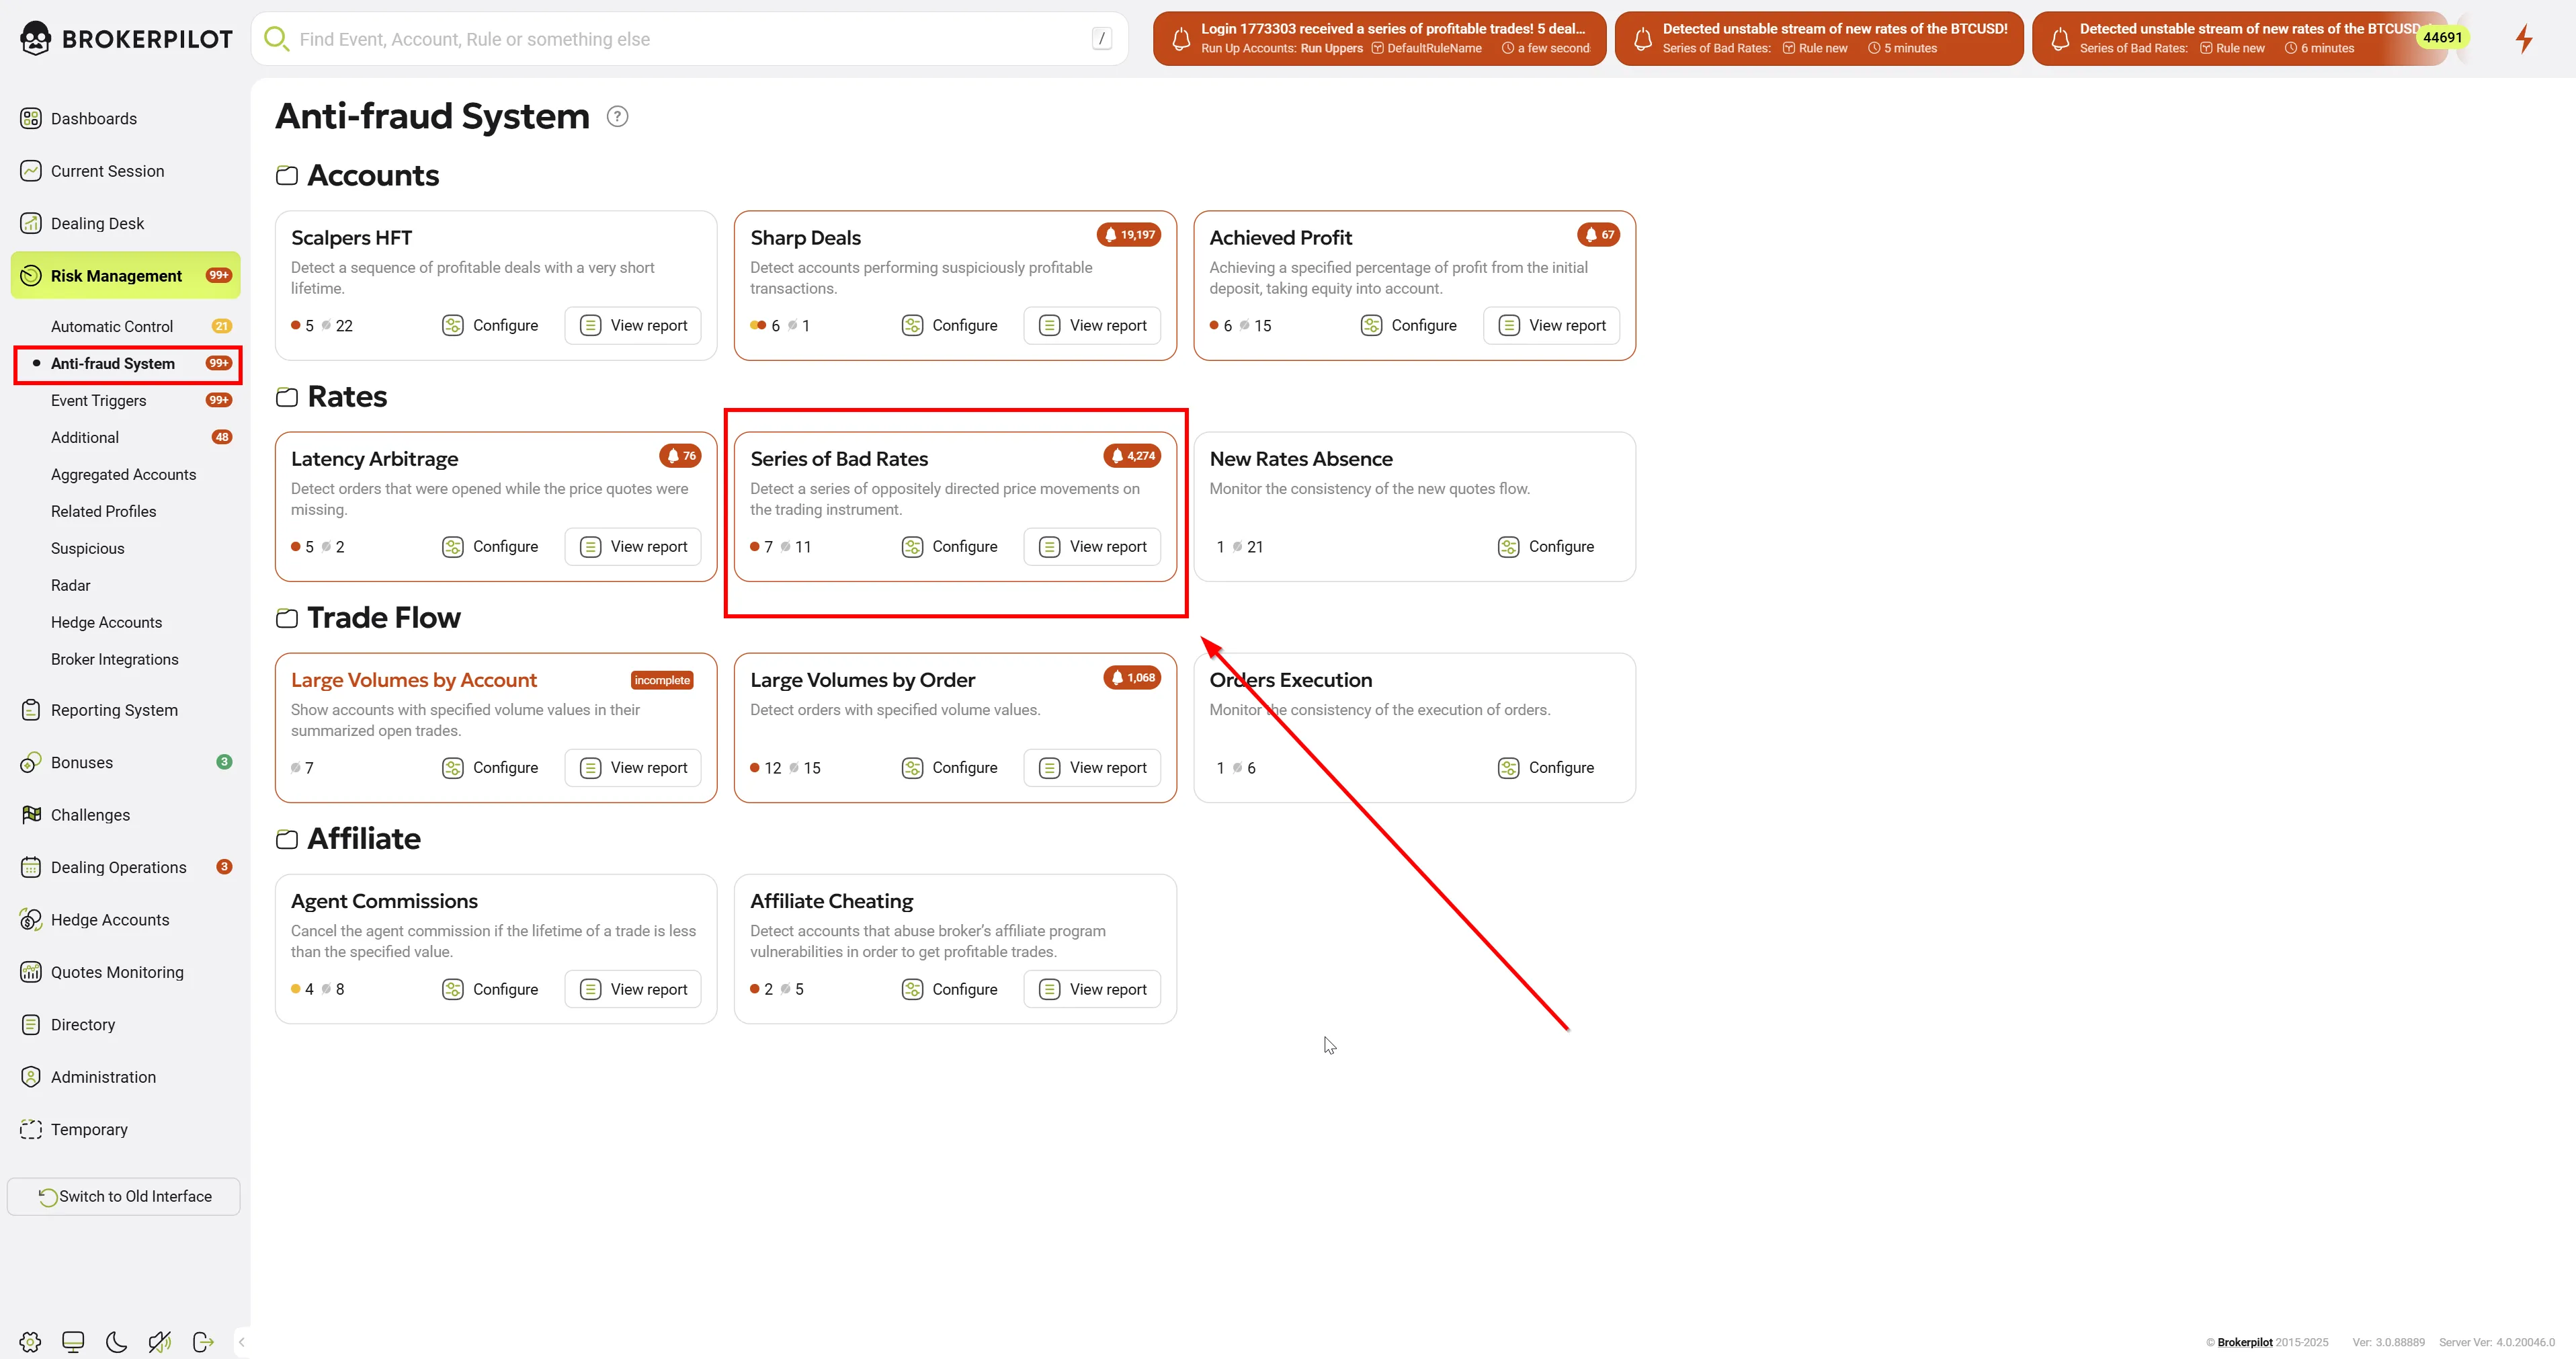
📌 You can find the Series of Bad Rates trigger under:
Risk Management → Anti-Fraud System
Edit Settings
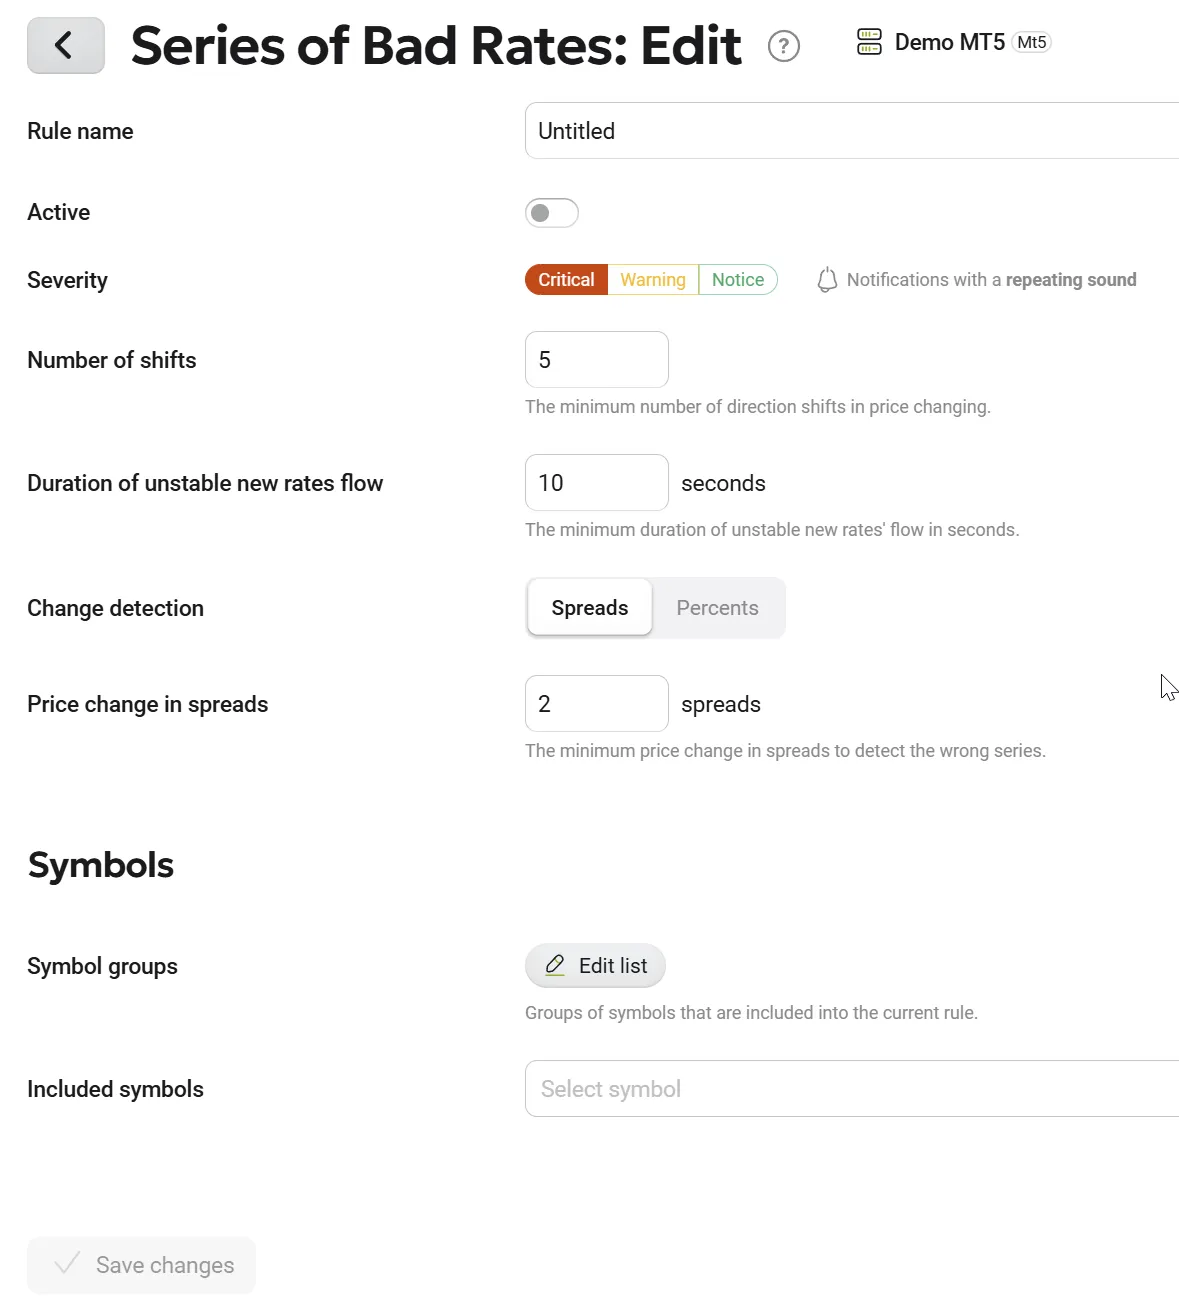
The following settings can be applied to the rule:
| Parameter Name | Description |
|---|---|
| Rule Name | Assign a custom name to the rule. |
| Number of Shifts | Defines how many opposite price movements are required for the trigger to activate. |
| Duration of Unstable New Rates Flow | The time limit (in seconds) for detecting a series of opposite price movements. |
| Change Detection | Choose the unit for measurement: percentage (%) or average spreads. |
| Price Change in Percents/Spreads | The threshold value (in % or spreads) to determine whether a price movement is significant enough to activate the trigger. |
| Symbol Groups | Select groups of symbols to be monitored. |
| Included Symbols | Select specific symbols to be monitored. |
Notifications
Series of Bad Rates — Event Details
The Series of Bad Rates notification displays detailed information about a detected price feed anomaly, including a visual bid/ask chart and a chronological list of received rates. This view is opened from a notification and is used for incident analysis and validation.
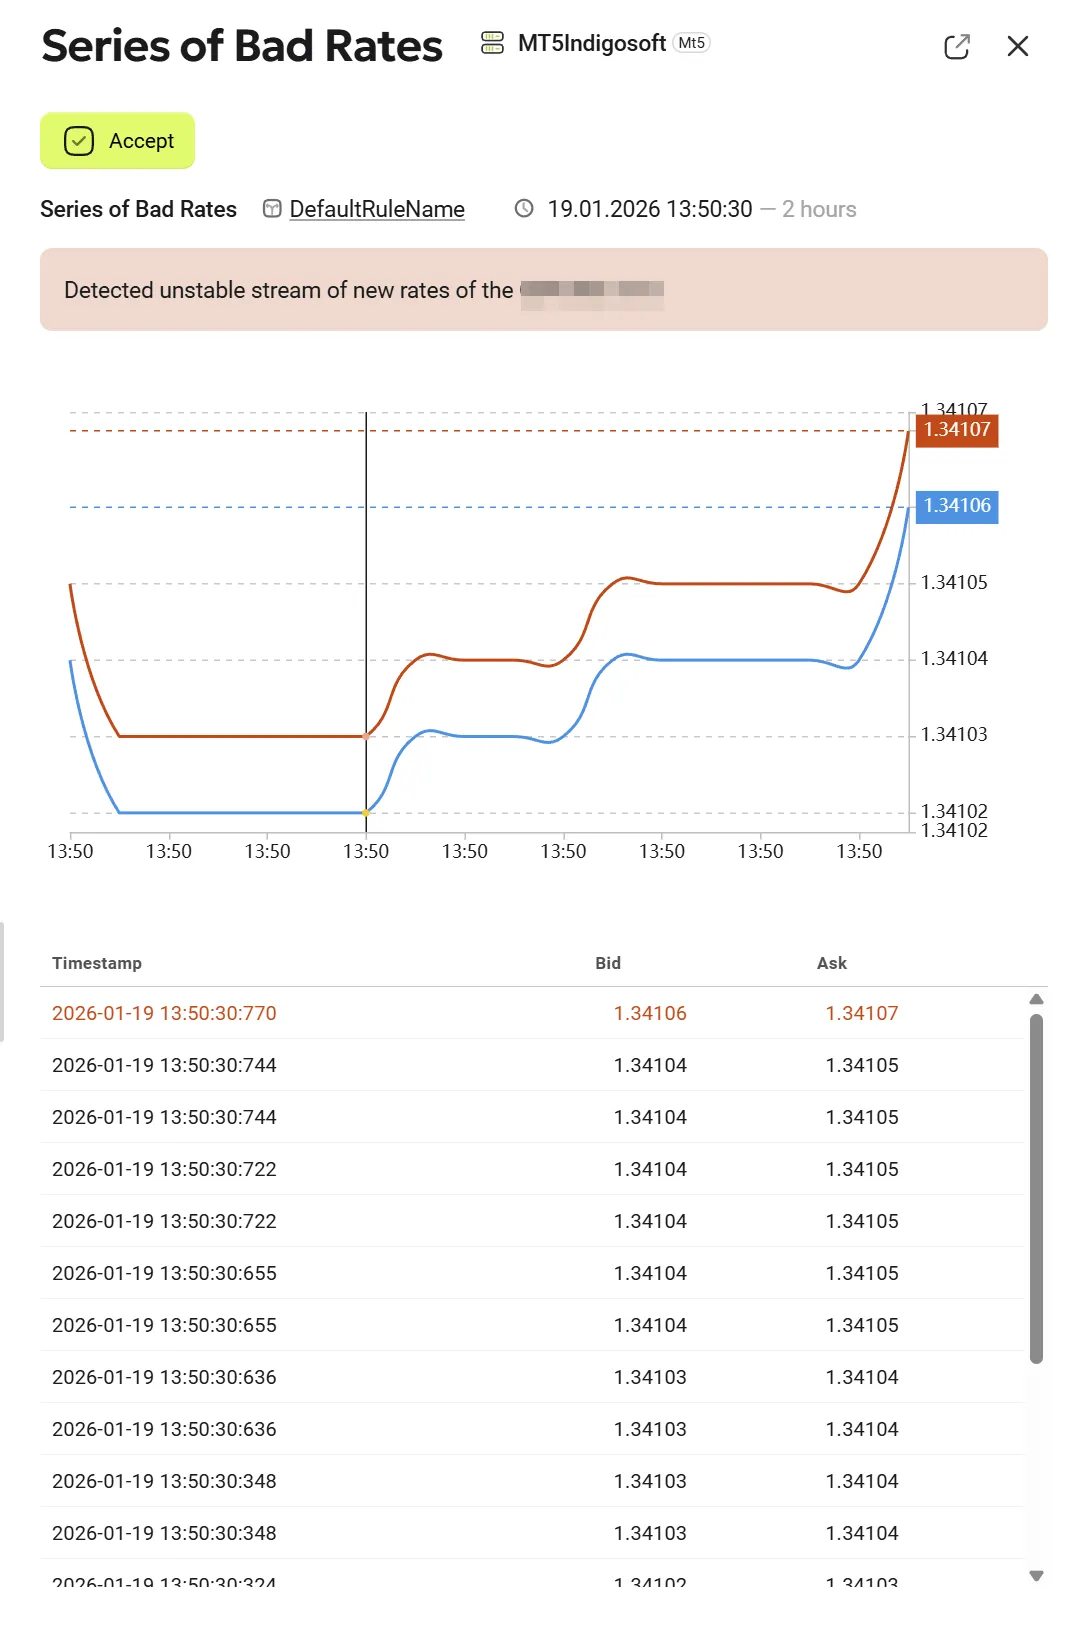
Bid / Ask Chart
The chart visualizes the price behavior during the detected interval:
- Bid price is shown as a blue line
- Ask price is shown as an orange line
- The X-axis represents time
- The Y-axis represents price levels
Additional visual elements:
- A vertical marker line indicates the moment associated with the selected table record
- Dashed horizontal lines represent reference price levels
- Current bid and ask values are displayed on the right side of the chart
The chart helps identify instability, gaps, or abnormal movements between bid and ask prices.
Rates Table
Below the chart, a table lists individual rate updates with the following columns:
- Timestamp – Exact time of the rate update (including milliseconds)
- Bid – Bid price value
- Ask – Ask price value
Table Behavior
- The table is displayed in reverse chronological order
- The most recent record is highlighted in red, indicating that this entry triggered the notification
- Older records follow below in descending time order
Chart and Table Interaction
- When hovering over a table row, the corresponding bid/ask pair is highlighted on the chart
- A tooltip appears on the chart, showing the exact bid and ask values for that record
- This interaction allows precise correlation between numeric data and visual price movement
Permissions
| MT4 | MT5 |
|---|---|
| No specific permissions are required. | No specific permissions are required. |
Trigger Logic
- The price movement is measured based on the selected unit (percentage or spreads).
- For each price tick, the trigger compares the current tick with the previous one and checks for two conditions:
- The price change exceeds the defined threshold (in % or spreads).
- The price movement is in the opposite direction to the previous one.
- If these conditions are met, the trigger records the price tick.
- If the number of shifts occurs within a time shorter than the "Duration of Unstable New Rates Flow", the trigger detects an event and generates a notification for the dealer.
Key Use Cases
In the fast-paced world of trading, maintaining a stable quote flow is essential for fair and transparent execution. However, low liquidity and technical issues with liquidity providers (LPs) can cause price distortions that traders may exploit. The Series of Bad Rates effectively detects such anomalies, ensuring brokers can react swiftly and prevent potential trading issues before they escalate.
1. Detecting Unstable Quote Flow (Price “Saw” Formation)
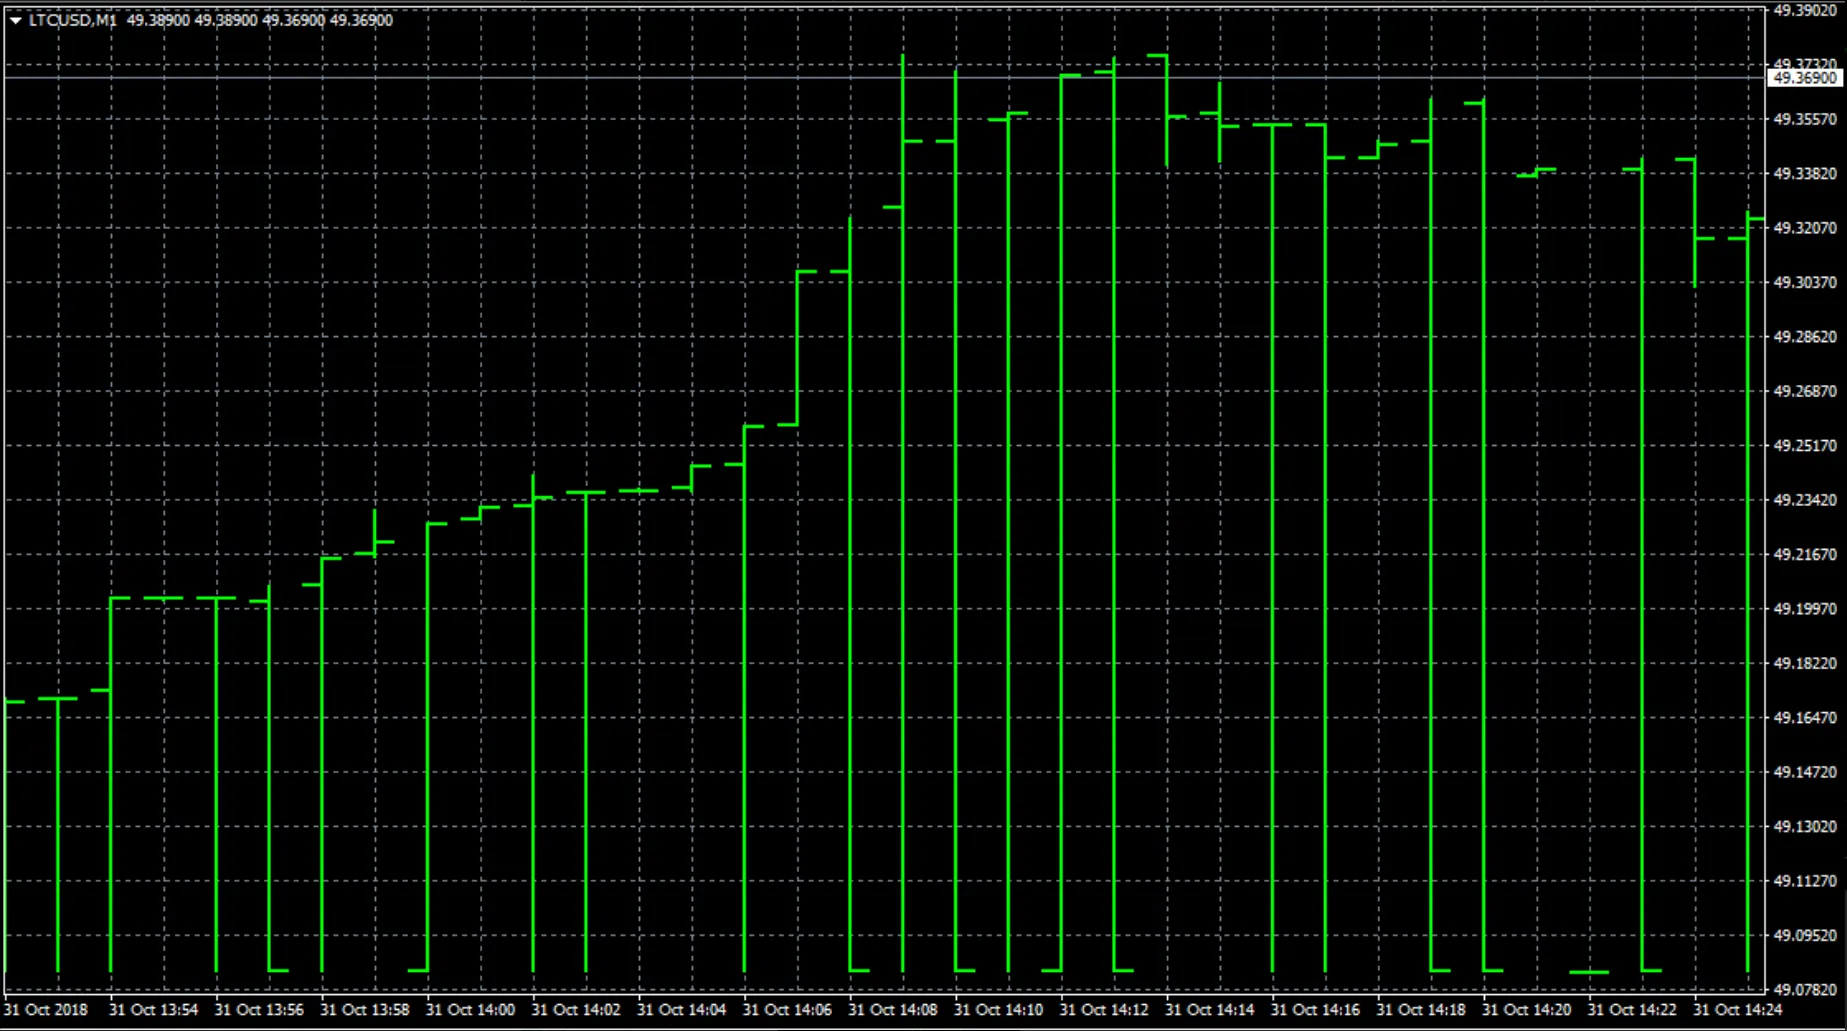
When liquidity drops, price movements can become erratic, forming a "saw" pattern on the chart. Skilled traders take advantage of this by placing limit orders to profit from artificial price swings. The trigger identifies these patterns in real-time, allowing brokers to:
✅ Investigate the source of abnormal price behavior
✅ Adjust liquidity settings to stabilize pricing
✅ Prevent traders from exploiting abnormal fluctuations
2. Identifying Liquidity Provider Quote Stream Failures
A more severe issue occurs when an LP's quote stream breaks down, causing two unrelated trading pairs to merge into one stream. For instance, a failure could result in USDJPY and EURUSD merging into a single EURUSD chart.
If such an anomaly goes unnoticed:
⚠️ Traders may execute trades on non-existent instruments
⚠️ The broker may need to cancel transactions, leading to disputes
⚠️ Clients could file complaints with regulators and post negative reviews
With this trigger in place, brokers receive immediate notifications of such incidents, enabling them to:
🔹 Pause trading on the affected instrument before traders exploit it
🔹 Coordinate with LPs to restore the correct quote stream
🔹 Prevent reputational damage and regulatory issues