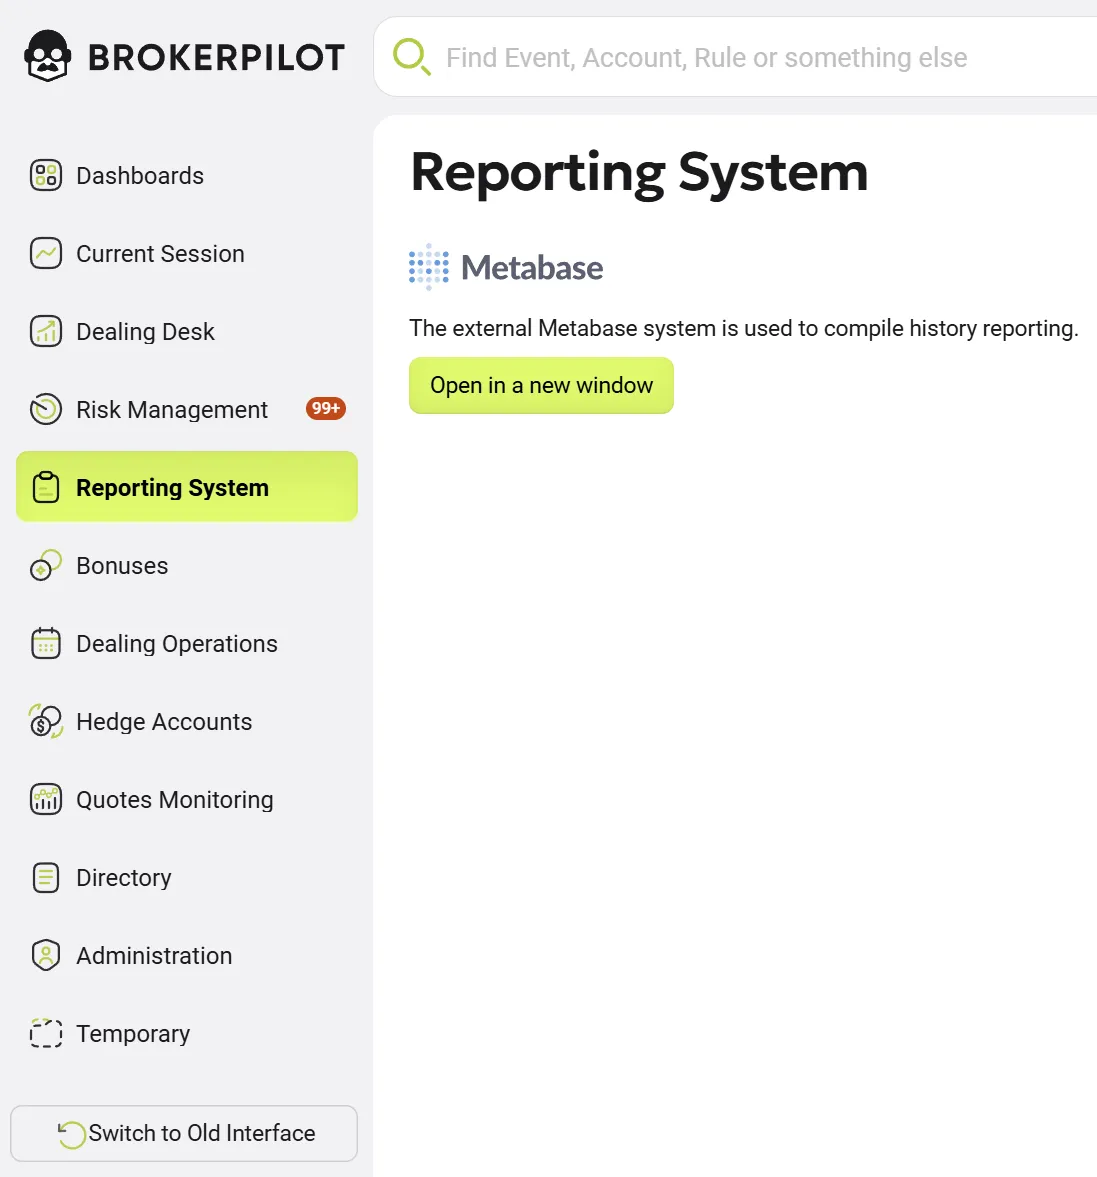
Reporting System
Historical data is just as important for a broker as current market conditions, which is why we have developed the concept of historical reports — Reporting. By clicking on the reporting button, the broker is directed to an external system Metabase where all historical data is stored and accumulated.
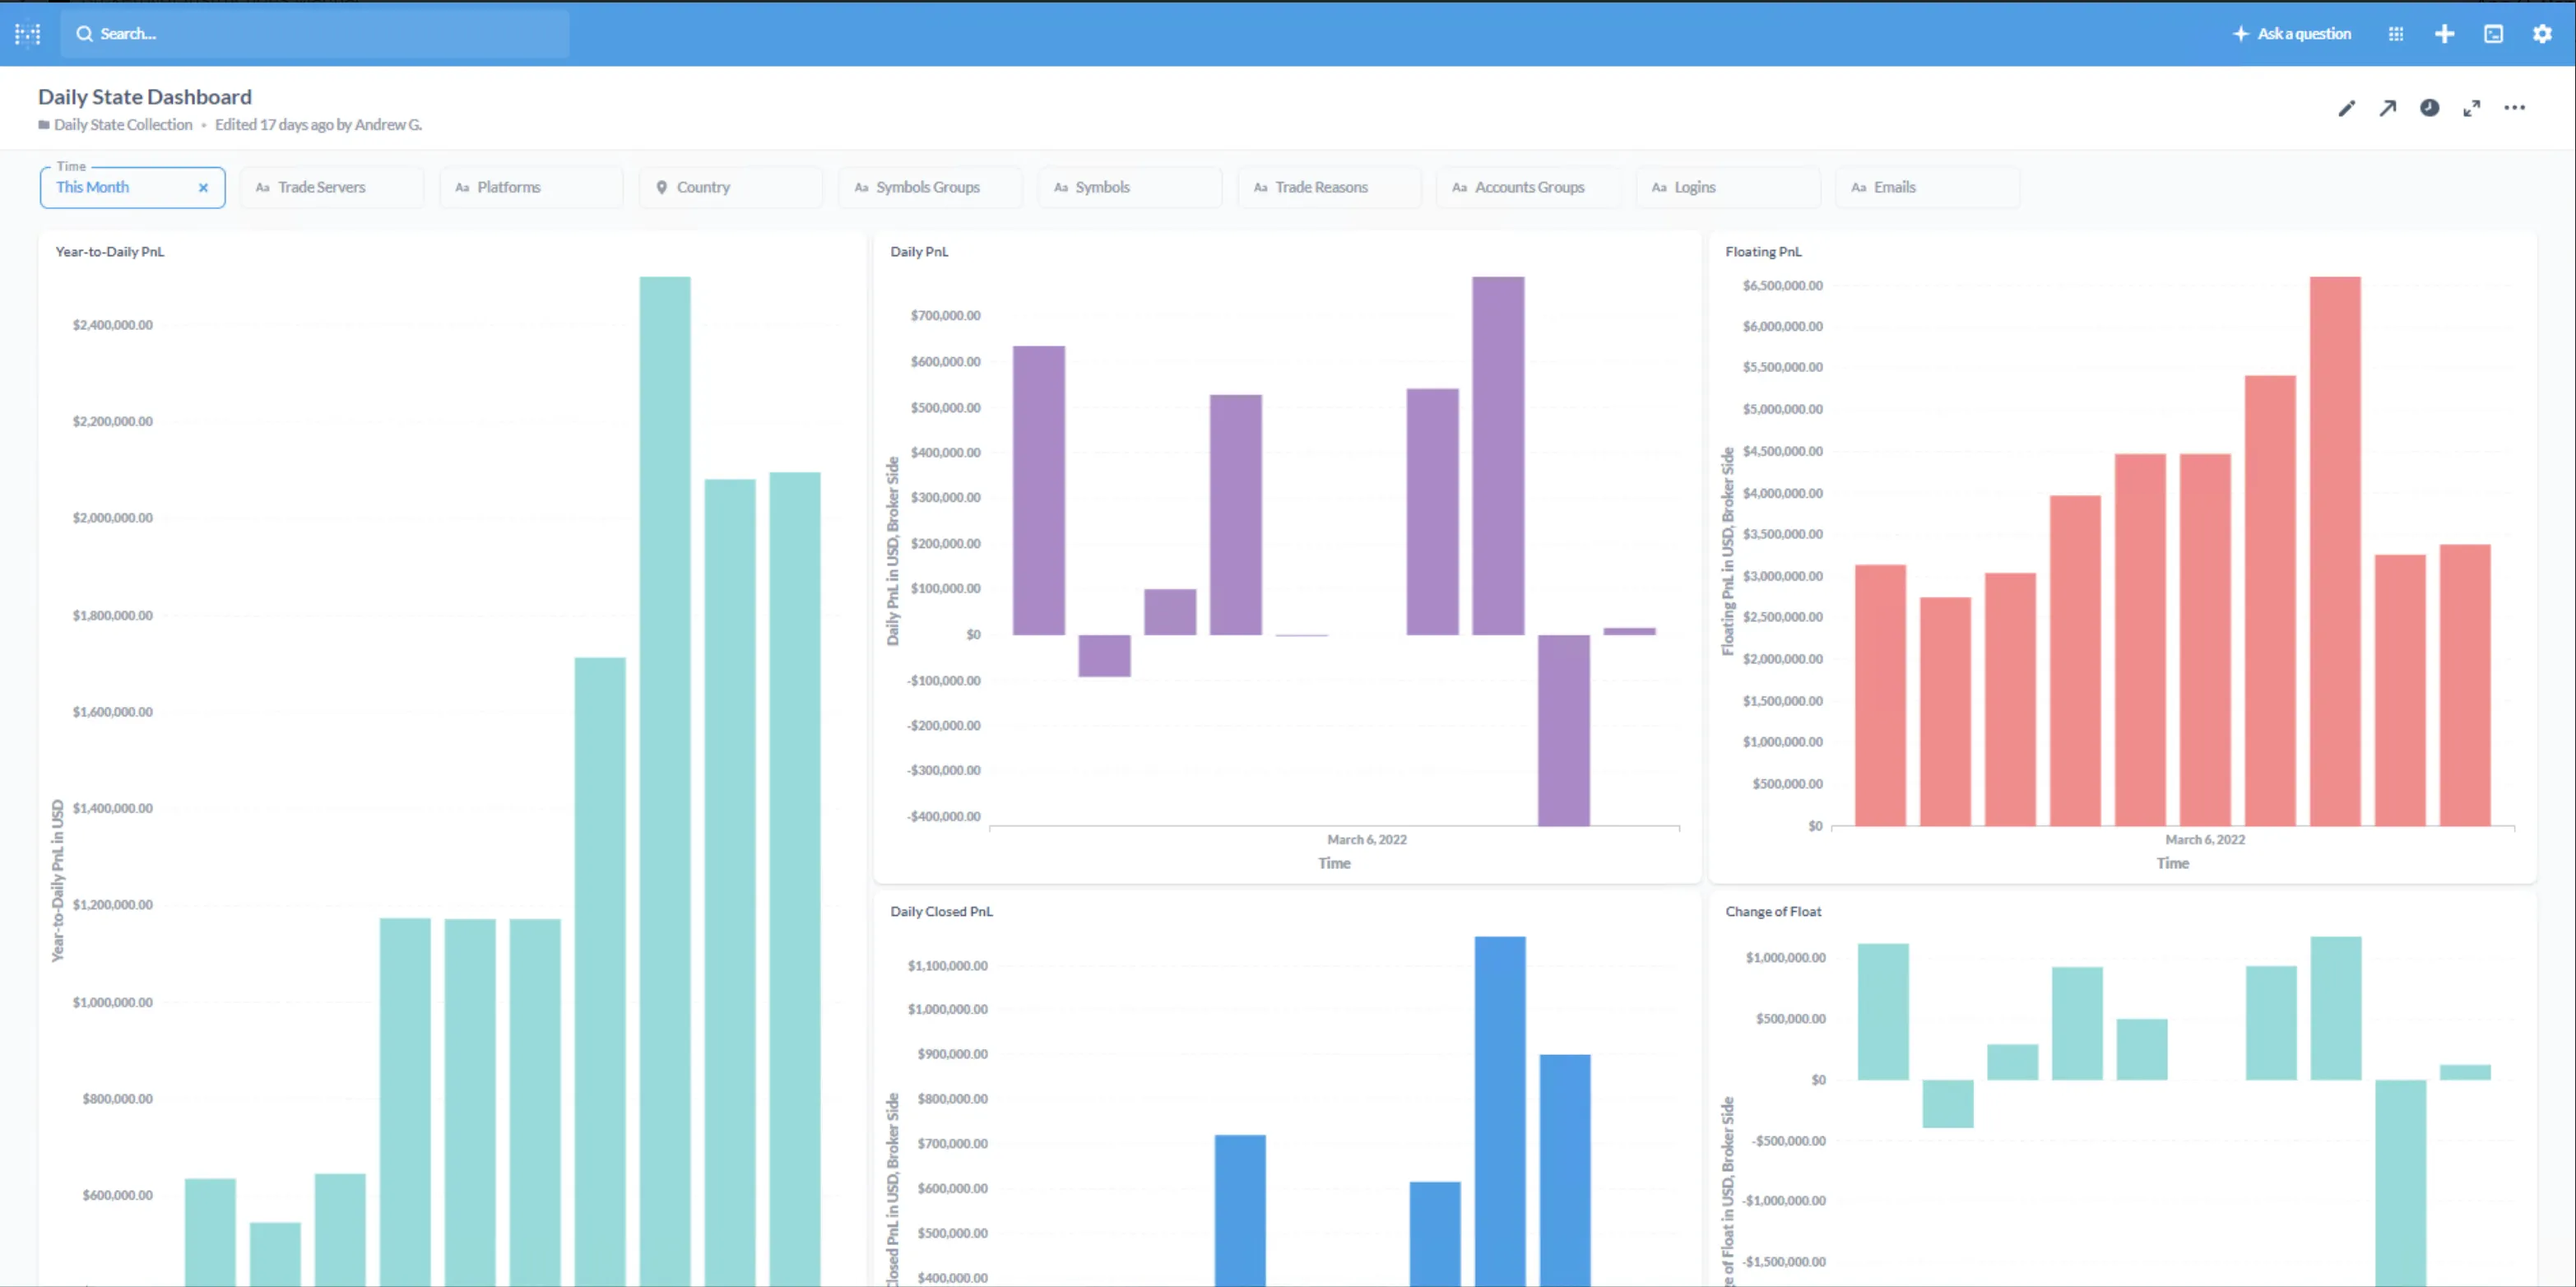
Our reporting collection includes over forty different reports and dashboards. Daily, weekly, and monthly PnL, reports by accounts, account groups, and instrument groups — these are just a small fraction of what can be found. Thanks to the flexible filtering system, you can access almost any subset of historical data. Additionally, with the export function, reports can be downloaded in a convenient format for further analysis.
If you require a specific report that is not currently available in our collection, just let us know. We have all the necessary data from your dealing desk, and it will be no trouble for us to provide you with the required information in the format that best suits your needs.
Note: Historical reporting does not appear instantly after the installation of Brokerpilot.
Please allow at least one day for changes to appear for a symbol, and other periods will adjust accordingly once enough historical data has accumulated for a week or month. This means that initially, larger periods will be calculated from the start of the history. For example, once a week’s data is accumulated, the six-month period will begin from that point.
Reports List
Out-of-the-box Reports
| N | Name of the report | Comments |
|---|---|---|
| 1. | Year-to-date P&L Report | This is a report showing your cumulative P&L. Time filter should be used to set the start date. |
| 2. | Daily P&L | This report is a sum of your daily closed profit and the difference in floating (unrealized) profit between a given day and the day before. Daily P&L = Closed P&L + Change Of Float - Commissions. |
| 3. | Floating P&L | Your daily floating PnL for all open positions including swaps. |
| 4. | Closed P&L | This report shows your daily closed (realized) profit. It includes commissions and swaps. |
| 5. | Change Of Float | This report shows the given day's floating PnL. Floating P&L (current date) - Floating P&L (previous day) = Change of Float (current date) |
| 6. | Year-to-daily Total Volume, lots | This is your cumulative report showing the total volume in lots. Time filter should be used to set the start date. |
| 7. | Year-to-daily Open Volume, lots | This is your cumulative report showing opened volume in lots. Time filter should be used to set the start date. |
| 8. | Year-to-Daily Closed Volume, Lots | This is your cumulative report showing closed volume in lots. Time filter should be used to set the start date. |
| 9. | Daily Total Volume, Lots | This is your daily total volume in lots. |
| 10. | Daily Opened Volume, Lots | This is your daily opened volume in lots. |
| 11. | Daily Closed Volume, Lots | This is your daily closed volume in lots. |
| 12. | Daily Total Volume, USD | This is your daily total volume in USD. |
| 13. | Daily Opened Volume, USD | This is your daily opened volume in USD. |
| 14. | Daily Closed Volume, USD | This is your daily closed volume in USD. |
| 15. | Daily Money Flow Report, USD | This report shows the difference between deposit and withdrawal. |
| 16. | Daily Deposits Report, USD | This report shows your daily total deposit. |
| 17. | Daily Withdrawals Report, USD | This report shows your daily withdrawal. |
| 18. | Daily Active Accounts | This report shows the accounts that made trades or balance transactions. |
| 19. | Balance, USD | This report shows the total balance at EOD. |
| 20. | Daily Commissions, USD | This report shows the daily agent commissions. |
| 21. | Equity, USD | This report shows the total equity at EOD. |
| 22. | Daily Swaps, USD | This report shows your total swaps. |
| 23. | Clients Ended In SO | This report shows the number of accounts ended with SO. |
| 24. | Daily Negative Balance Adjustments, USD | This report shows your daily adjustments of negative balances. |