Open Positions
1. Overview
The Open Positions page provides a comprehensive list of all active trades across the brokerage, allowing risk managers and dealers to track exposure, analyze profitability, and manage market risk instantly and also allows quick switching between different risk models: A-Book, B-Book, and C-Book.
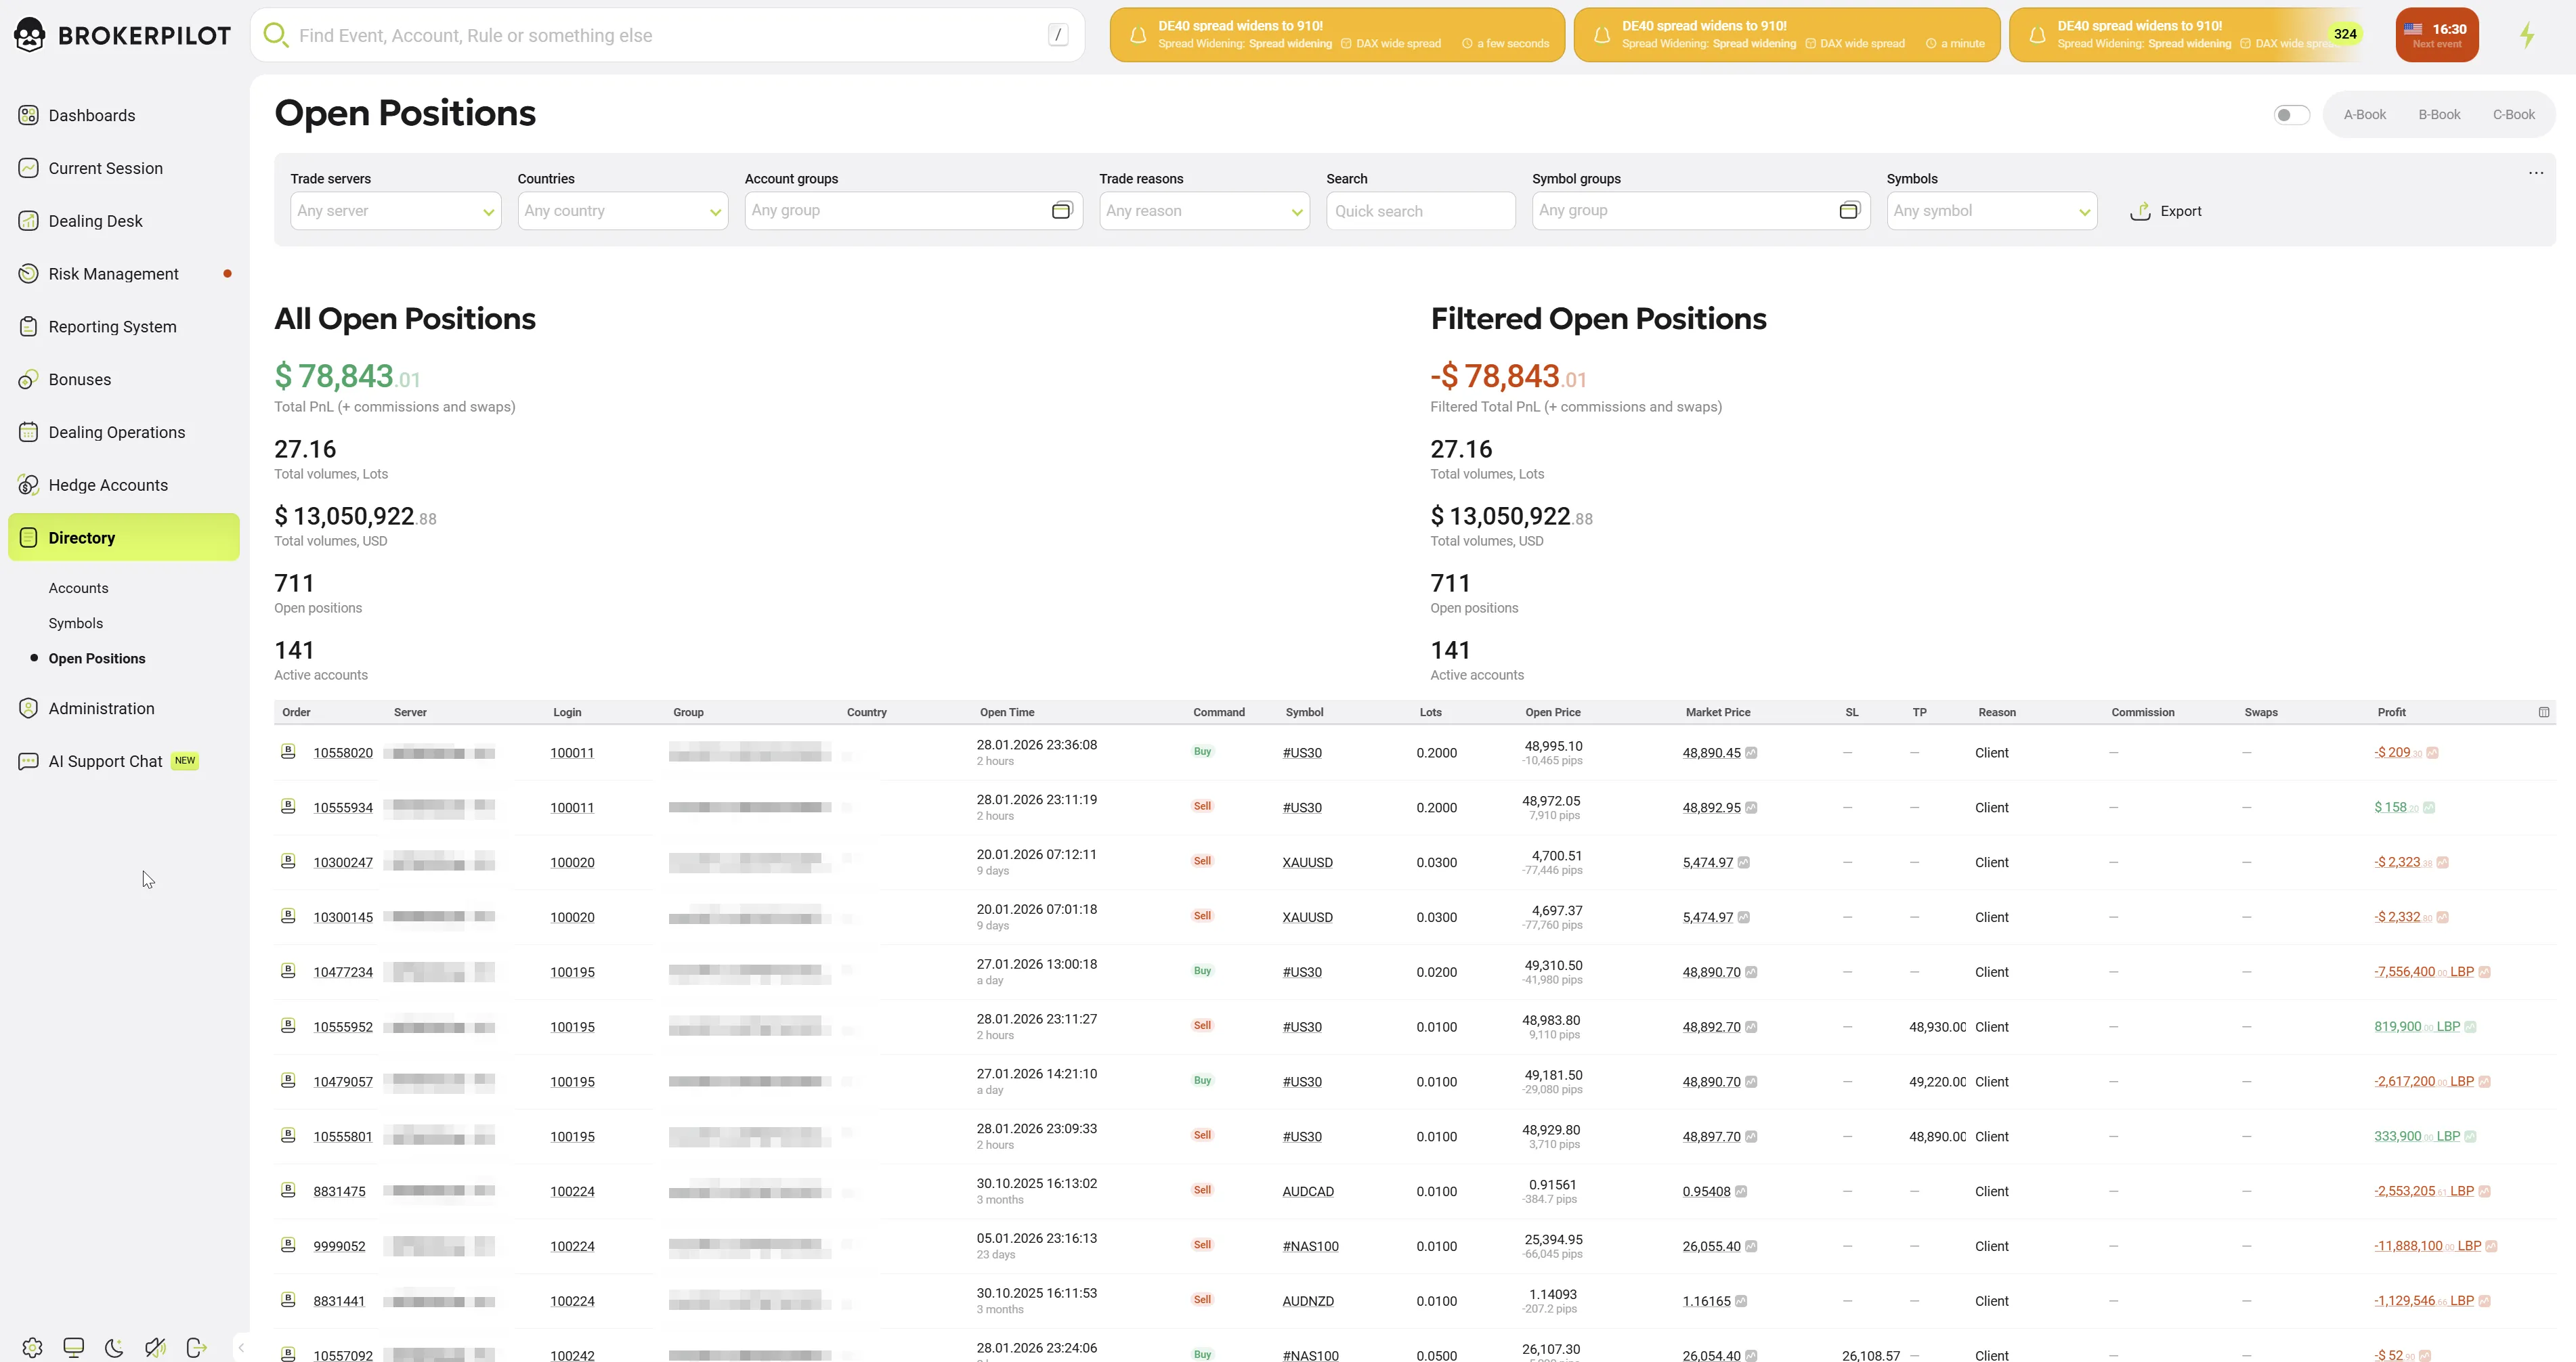
2. Dashboard Statistics
The top section of the page provides a split-view summary of the brokerage's current exposure:
- All Open Positions (Left): Displays aggregate metrics for the entire system, including Total PnL (Profit & Loss), Total Volume (in Lots and USD), and the total count of open positions and active accounts.
- Filtered Open Positions (Right): Displays the same metrics but dynamically recalculated based on the active filters (e.g., showing exposure only for a specific "Gold" symbol group or a specific country).
3. Search and Filtering
A robust filtering bar allows users to segment the global order book:
- Trade Servers: Select specific platforms (e.g., MT4, MT5).
- Countries: Filter by client region.
- Account Groups: Isolate specific client types (e.g.,
realECN,demoStandard). - Trade Reasons: Filter by the origin of the trade (e.g.,
Client,Robot,Dealer). - Symbols / Groups: Filter by specific assets or asset classes.
4. Positions Data Grid
The main table lists individual active trades. Key columns include:
- Order: The unique ticket number. (See Interactive Features below).
- Server / Login: The platform icon and client account number.
- Command: Trade direction (Buy in Green, Sell in Red).
- Symbol: The instrument being traded. (See Interactive Features below).
- Lots: The volume of the trade.
- Open Price / Market Price: The entry price vs. the current live price. (See Interactive Features below).
- Profit: Real-time floating profit or loss.
5. Interactive Drill-Down Features
The grid supports deep analysis through specific click actions on column data:
A. Position Details
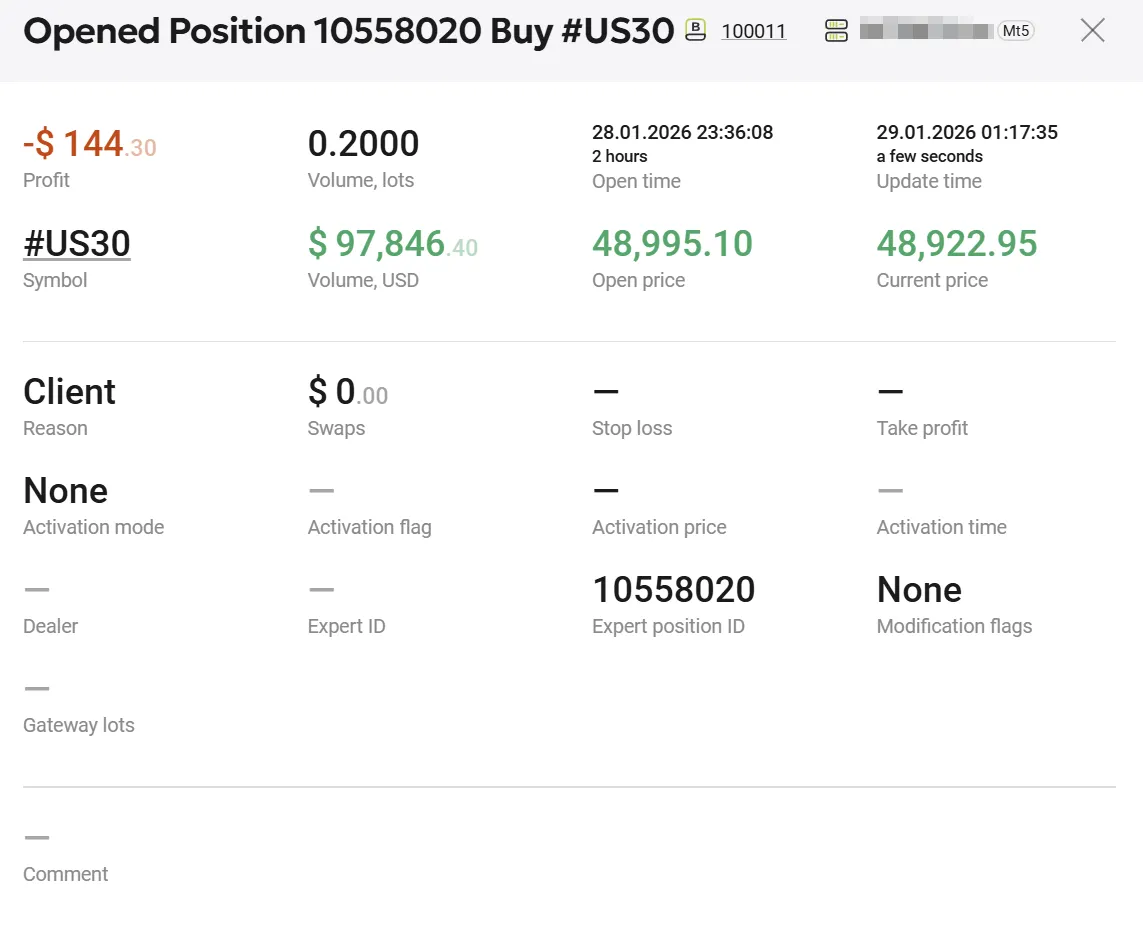
Action: Click on the Order number. View: Opened Position Details Modal This view provides a complete audit trail for a single trade, including:
- Financials: Exact Profit, Volume (Lots & USD), and accrued Swaps.
- Timing: Exact Open time and last Update time (down to the second).
- Execution: Stop Loss (SL) and Take Profit (TP) levels, Activation prices, and Gateway lots (if bridged).
- Tech Data: Expert ID (if traded by a bot) and Dealer remarks.
B. Volume Analysis
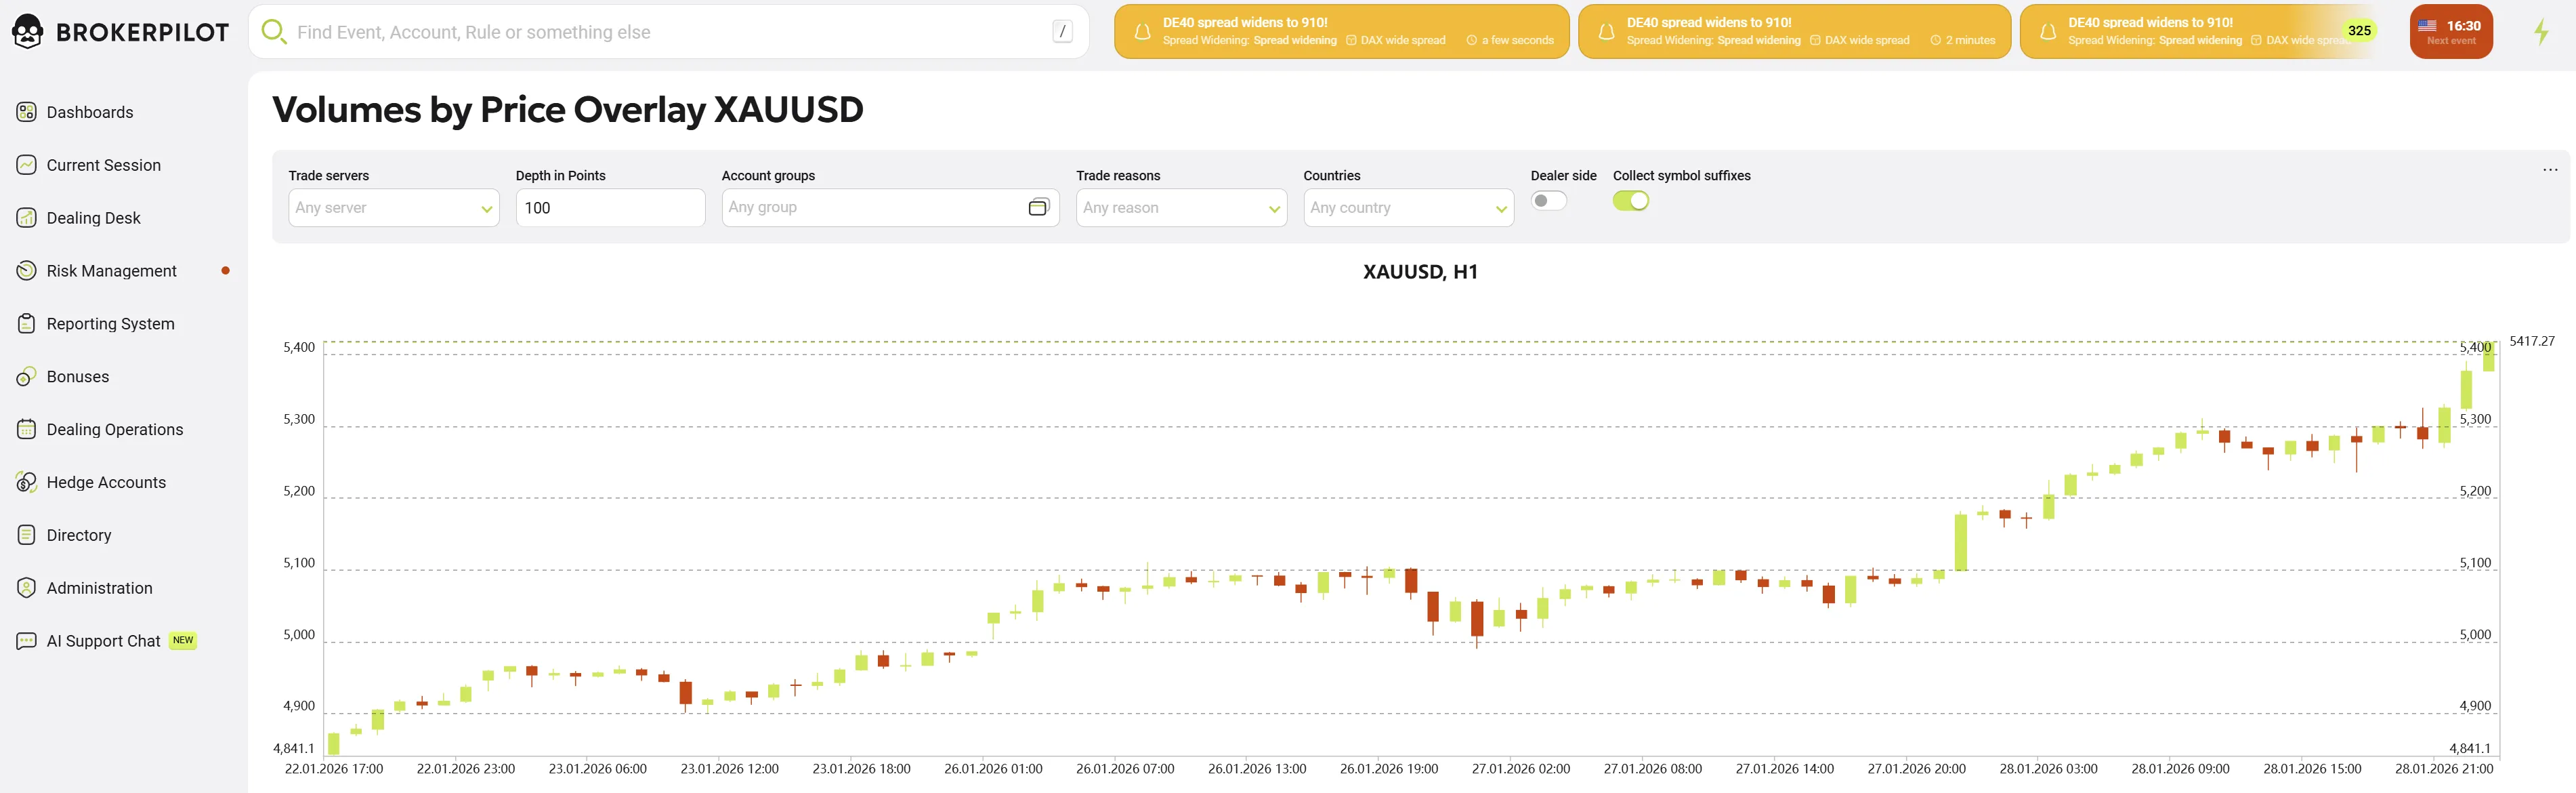
Action: Click on the Symbol name (e.g., #US30).
View: Volumes by Price Overlay Chart
This analytical tool displays:
- Volume Profile: A histogram overlaid on the price chart showing where trading volume is concentrated.
- Market Depth: Helps dealers visualize support and resistance levels based on actual volume rather than just price action.
- Controls: Options to adjust depth in points and toggle "Dealer side" visibility.
C. Live Technical Chart
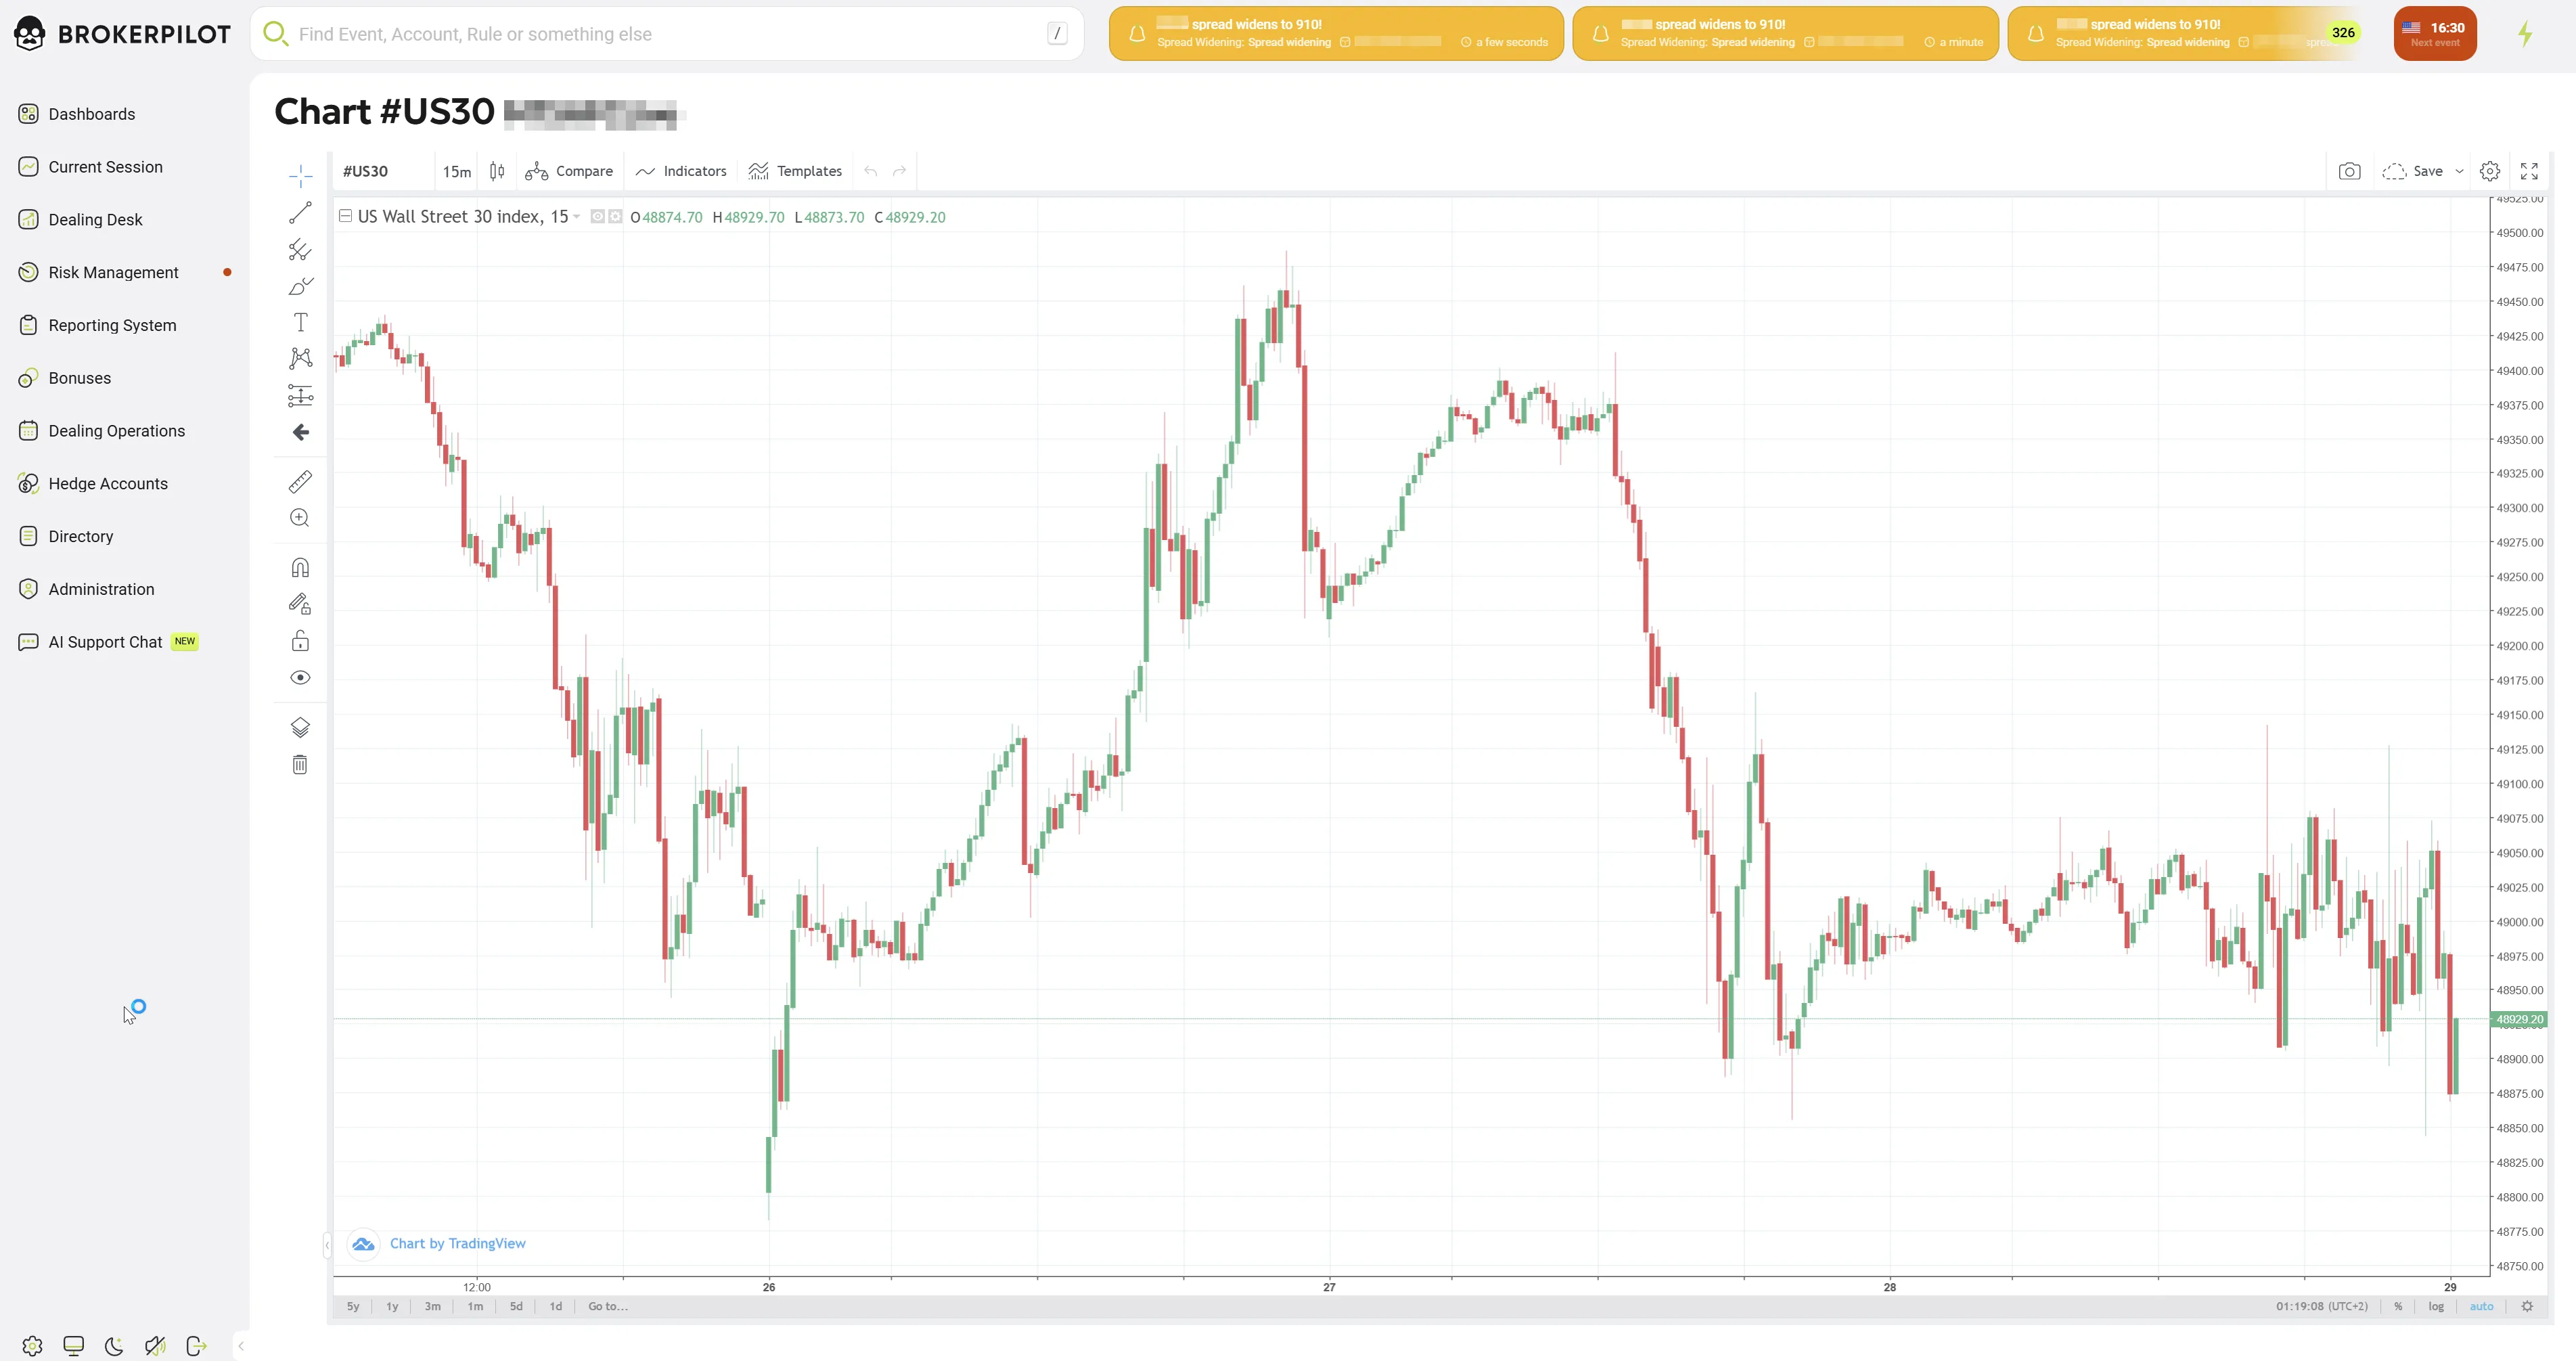
Action: Click on the Market Price value. View: Standard Technical Chart This opens a full-featured charting interface (TradingView style) for the specific symbol:
- Verification: Allows dealers to visually compare the client's position against live market movements.
- Analysis: Supports time-frame switching (15m, 1h, etc.) and technical indicators to assess immediate market trends.