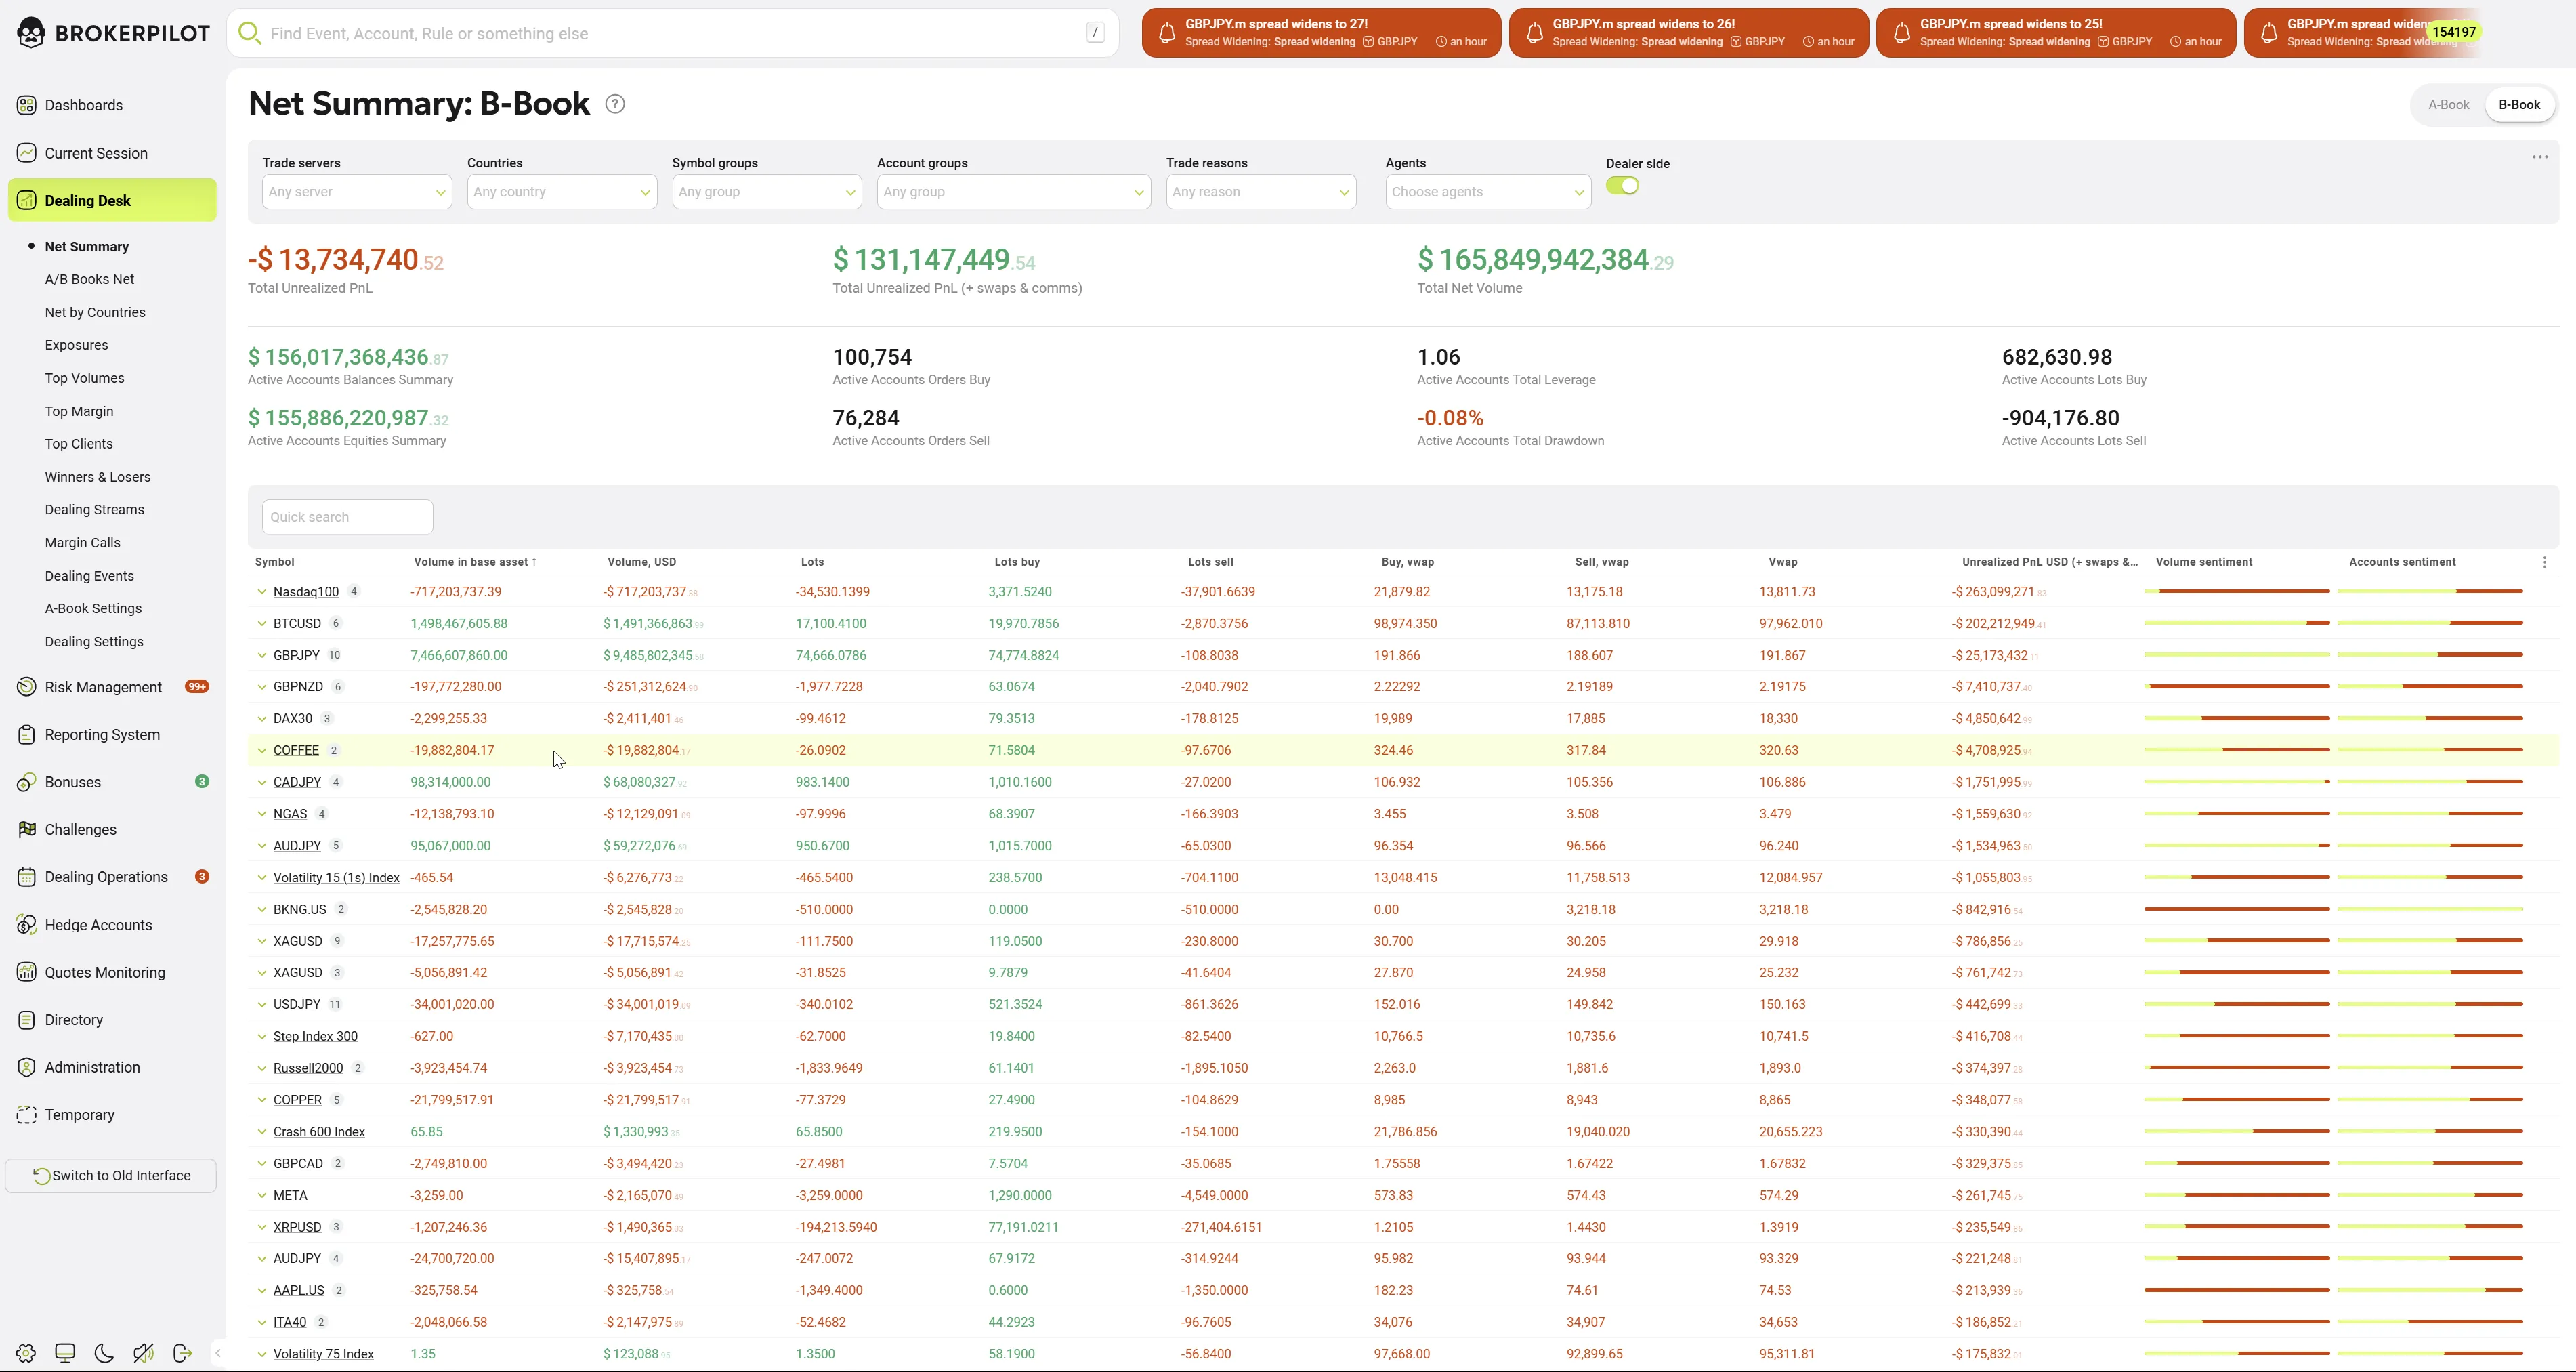
Net Summary
The Net Summary page provides a consolidated real-time overview of trading exposure, profitability, and client activity for the selected execution book. Using the tabs at the top of the page, users can switch between A-Book and B-Book, with all metrics, charts, and tables dynamically recalculated for the chosen book.
This page is primarily used by dealers and risk managers to monitor aggregated PnL, net exposure, leverage, and symbol-level concentration.
Purpose
The Net Summary page enables quick assessment of:
- Financial performance of the selected book (A-Book or B-Book)
- Net client exposure by instrument
- Trading activity, leverage, and drawdown across active accounts
- Symbols contributing most to risk or PnL
Book Selection
At the top of the page, A-Book / B-Book tabs allow switching the data context:
- A-Book – Displays metrics related to externally hedged trades
- B-Book – Displays metrics related to internally managed trades
All values on the page strictly correspond to the currently selected book.
Filters and Controls
Global filters at the top of the page allow narrowing the data scope:
- Trade servers – Filter by trading server
- Countries – Filter by client country
- Symbol groups – Filter by instrument group
- Account groups – Filter by account classification
- Trade reasons – Filter by order execution reason
- Agents – Filter by IB/agent
- Dealer side toggle – Enable or disable dealer-side view
All widgets and tables are updated in real time according to the selected filters and book.
Key Metrics Summary
| Parameter Name | Description |
|---|---|
| Total Unrealized Profit (+ Commissions & Swaps), USD | The total unrealized profit of all deals, including commissions and swaps. |
| Total Unrealized Profit, USD | The total unrealized profit of all deals, excluding commissions and swaps. |
| Active Accounts Orders - Sell | The number of active sell orders. |
| Active Accounts Balances Summary, USD | The total balance of active accounts. |
| Active Accounts Equities Summary, USD | The total equity of active accounts. |
| Active Accounts Orders - Buy | The number of active buy orders. |
| Total Net Volume, USD | The total net volume history. |
| Active Accounts Total Leverage | The total leverage of active accounts. |
| Active Accounts Total Drawdown | The total drawdown of active accounts. |
| Active Accounts Lots - Buy | The total buy lots of active accounts. |
| Active Accounts Lots - Sell | The total sell lots of active accounts. |
| Buy, VWAP | The volume-weighted average price of buy orders. |
| Sell, VWAP | The volume-weighted average price of sell orders. |
| VWAP | The overall volume-weighted average price. |
Sentiment Indicators
Sentiment indicators provide a quick overview of market trends.

Market Makers
While viewing the Net Summary, brokers can also access a detailed view of Session Market Makers for a selected trading symbol.
To access this section, click on the trading instrument name.
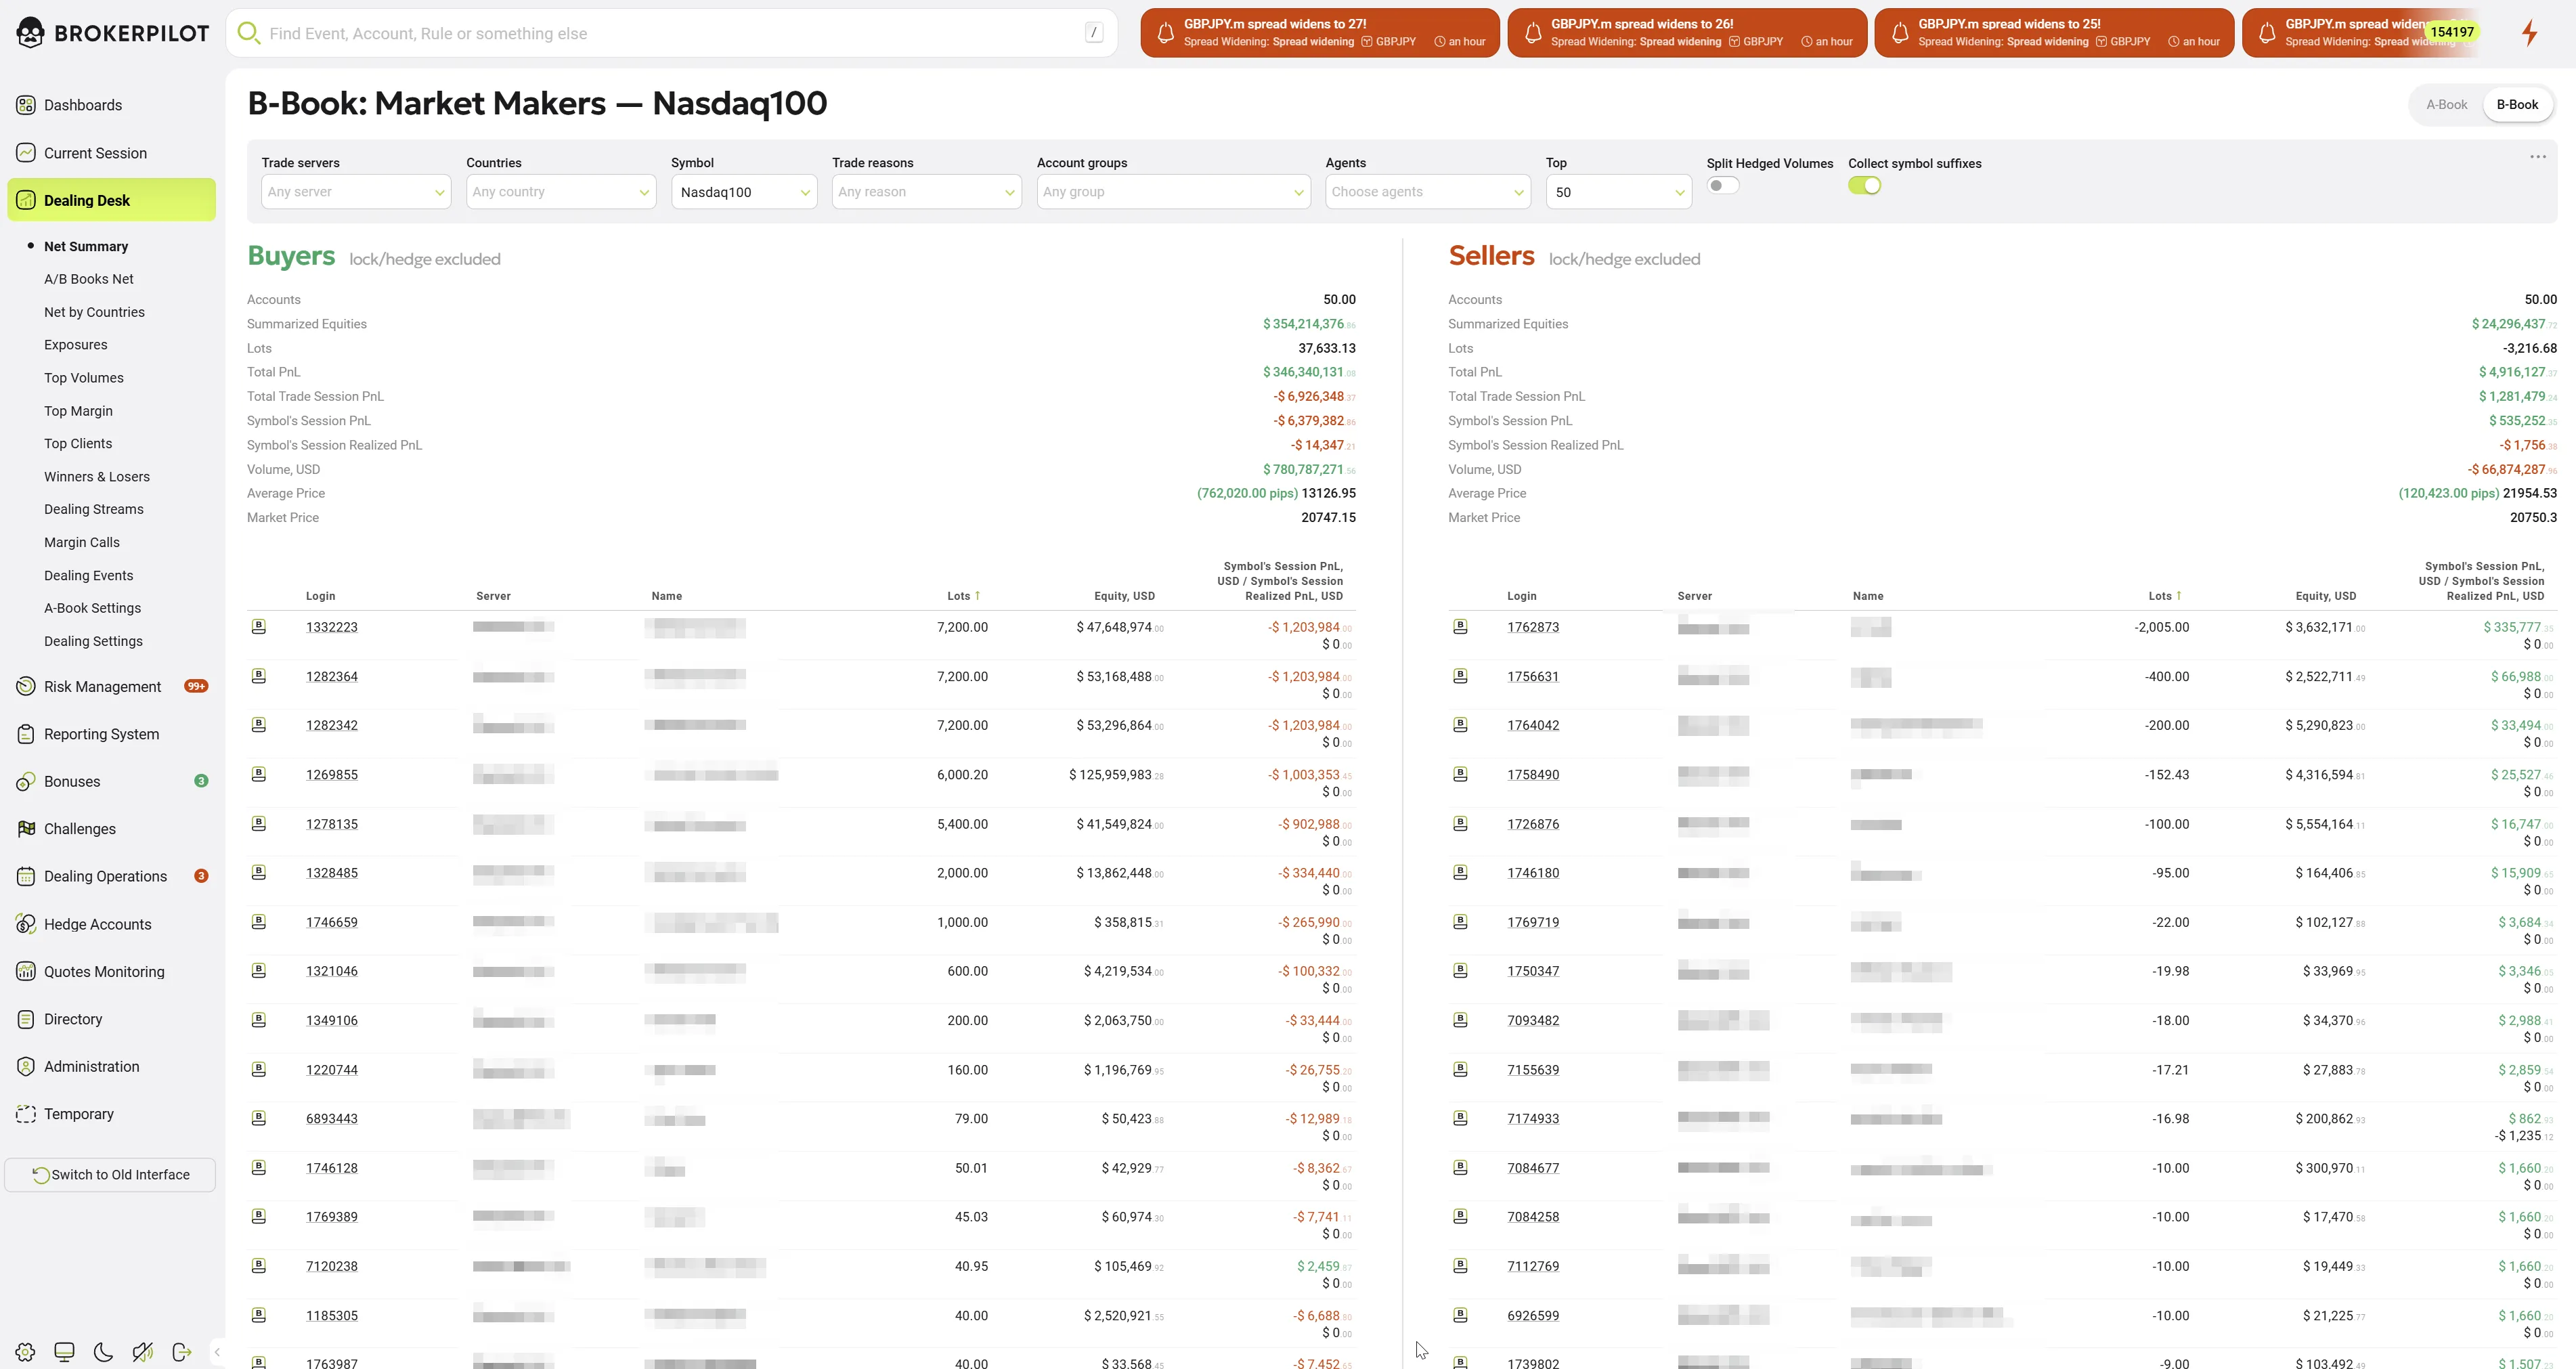
Note:
- The number of displayed accounts can be adjusted using the filter option (Top) at the top of the page.
- Locked and hedged positions are not included in the market makers list.
Market Makers Parameters
| Parameter Name | Description |
|---|---|
| Summarized Equities, USD | The total equity of accounts buying or selling a selected trading symbol. |
| Lots | The total BUY or SELL lots in open positions for the selected instrument. |
| Total Profit, USD | The total profit of accounts buying or selling a selected symbol. |
| Total Trade Session Profit, USD | The total trade session profit of accounts buying or selling a selected symbol. |
| Symbol's Session Profit, USD | The session profit for the selected symbol. |
| Symbol's Session Realized Profit, USD | The realized session profit for the selected symbol. |
| Volume in USD | The total volume of all open trades for the selected symbol. |
Top Net Volumes
The Top Net Volumes chart highlights instruments with the largest net exposure within the selected book and also can be found in the Exposures section on the left panel.
It helps identify symbols that currently represent the highest concentration of volume or directional risk.
The list can be expanded using Show more.
Data Table
The Data table contains detailed symbol-level statistics for the selected book:
- Symbol
- Volume in base asset
- Volume (USD)
- Total lots
- Lots buy / lots sell
- Buy VWAP / Sell VWAP
- VWAP (net)
- Unrealized PnL (USD, incl. swaps & commissions)
- Volume sentiment – Visual comparison of buy vs sell volume
- Accounts sentiment – Distribution of long vs short accounts
The table supports quick search and sorting for in-depth analysis.
Heatmap
The Heatmap tab provides a visual representation of trading volume distribution for the selected book (A-Book or B-Book). It complements the tabular view by allowing quick identification of symbols with the highest concentration of activity.
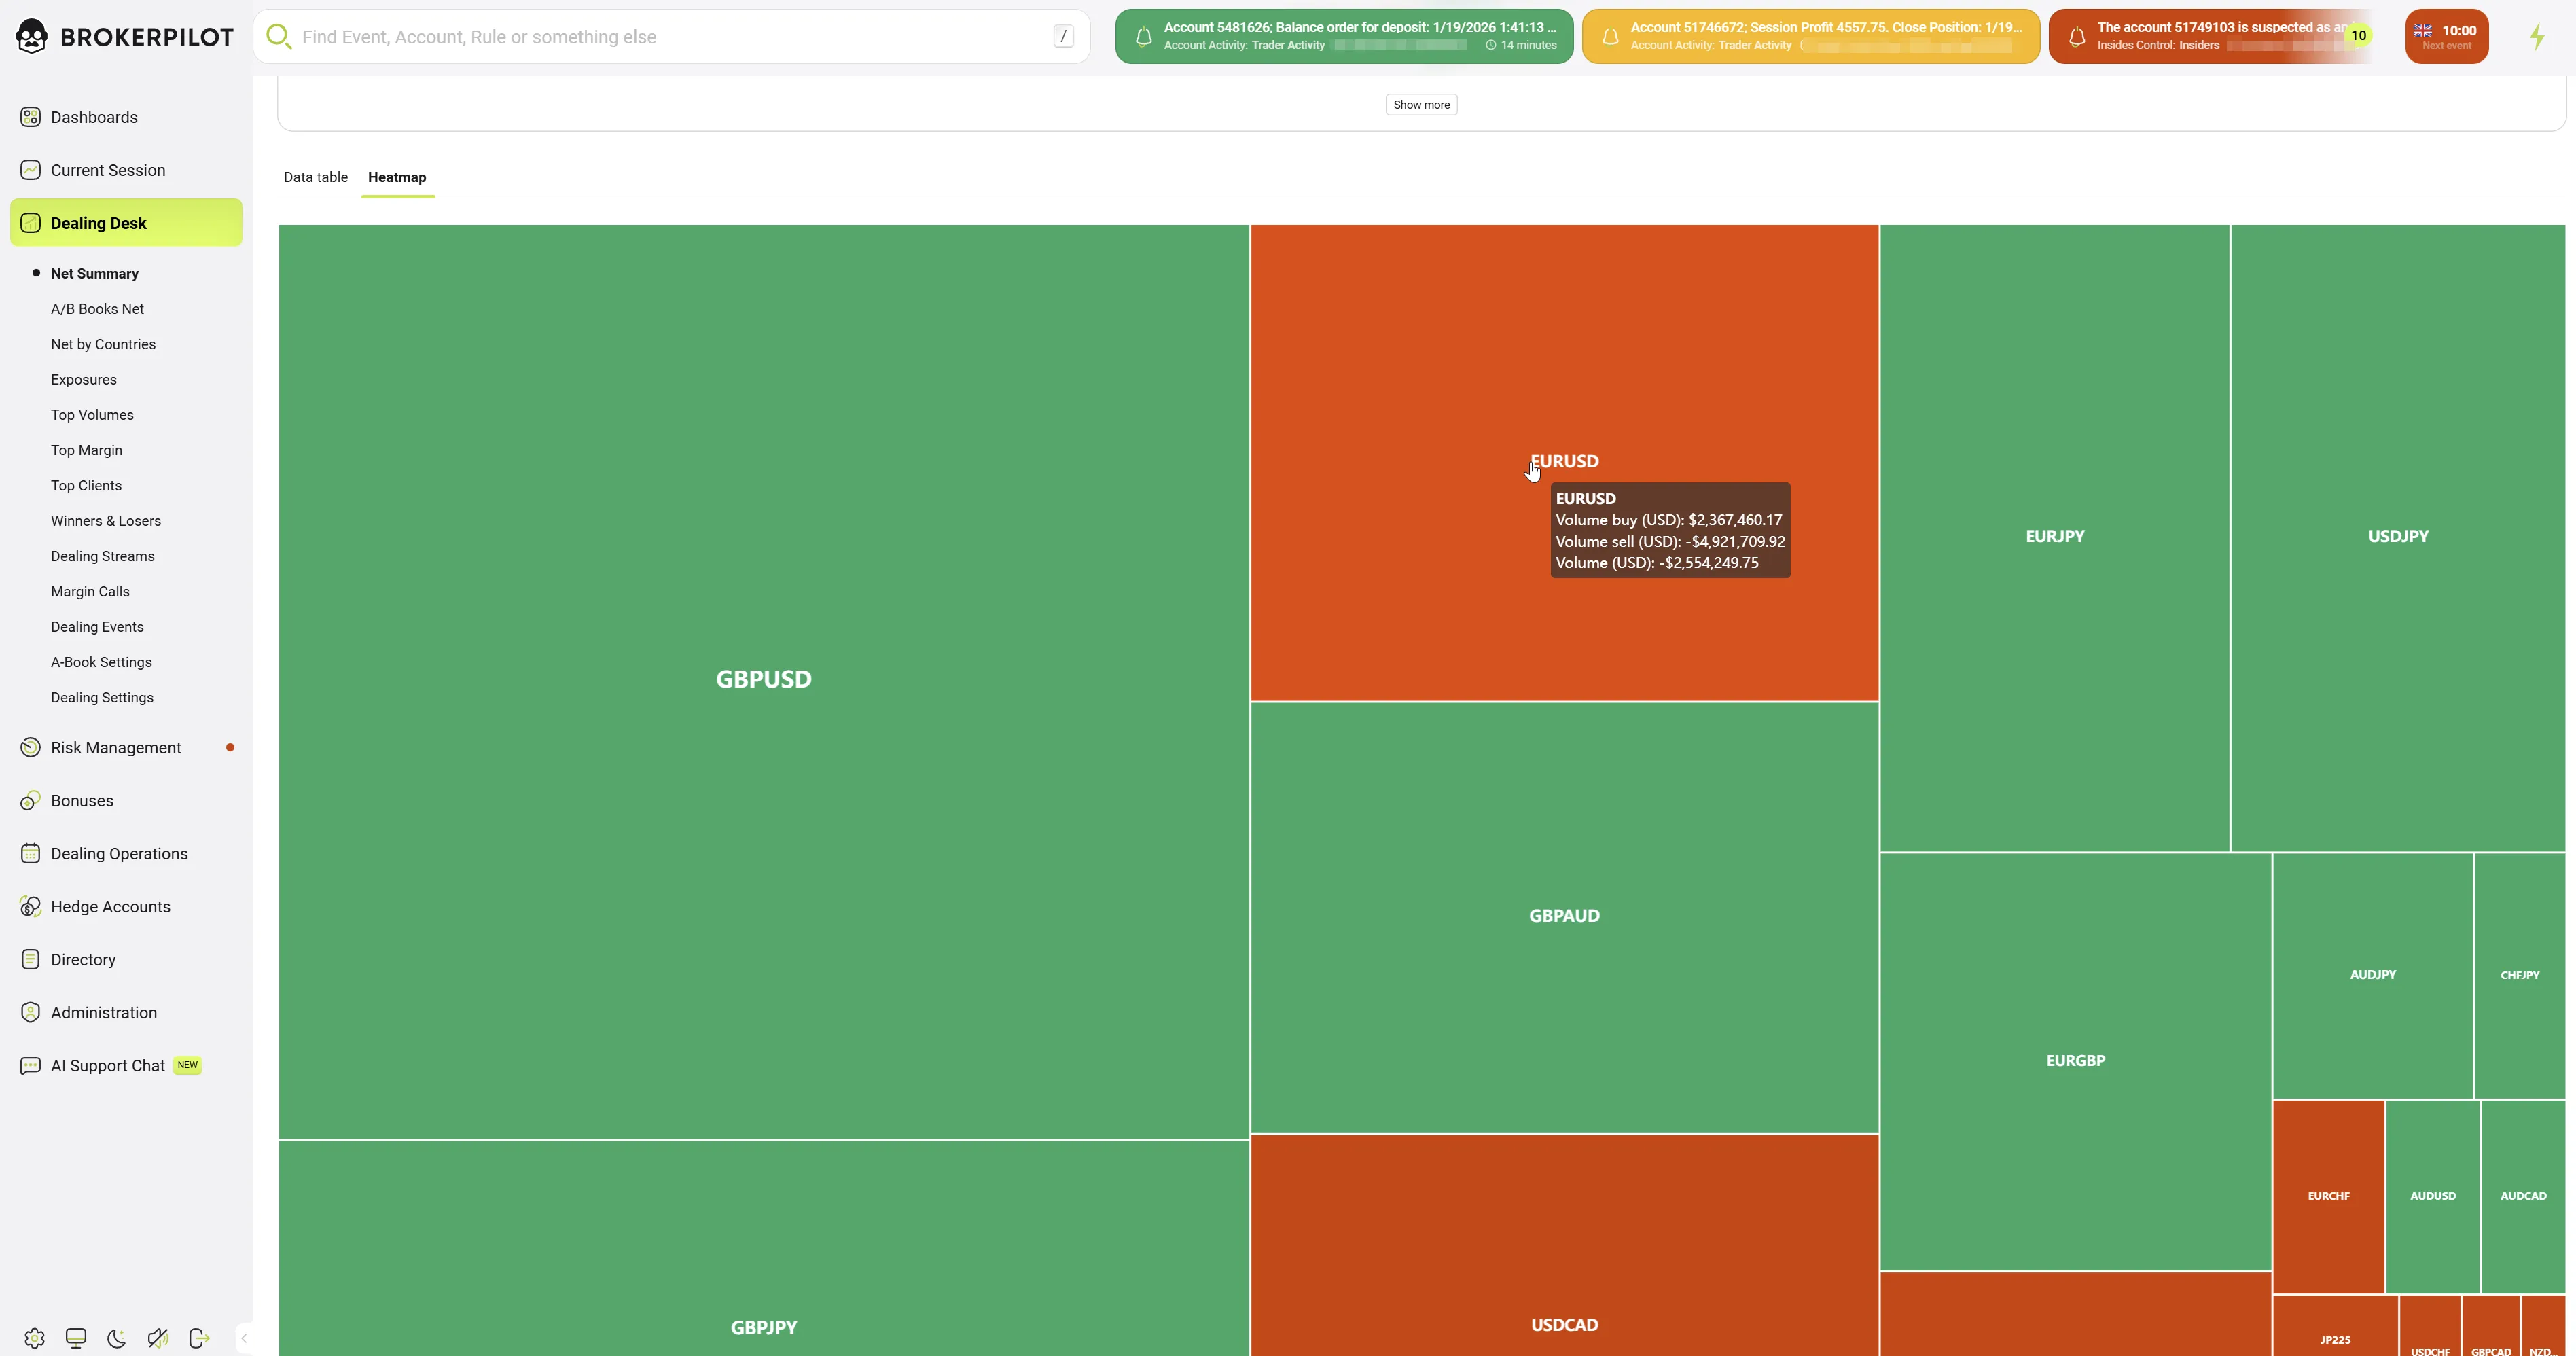
Purpose
The Heatmap is designed to:
- Quickly highlight instruments with dominant trading volumes
- Visually compare relative volume sizes across symbols
- Identify concentration risk at a glance
Visualization Logic
- Each rectangle represents a single trading symbol
- The size of the rectangle corresponds to the symbol’s total trading volume
- Larger areas indicate higher relative volume within the selected book
- The heatmap is recalculated dynamically based on:
- Selected book (A-Book or B-Book)
- Active global filters (servers, countries, symbol groups, accounts, etc.)
Tooltip Information
Hovering over a symbol displays a tooltip with detailed metrics, including:
- Symbol name
- Volume in base asset
- Volume (USD)
- Volume buy (USD)
- Volume sell (USD)
This allows precise inspection without switching back to the data table.
Usage Notes
- All data is updated in real time.
- Metrics and positions are shown only for the currently selected book.
- Color coding is consistent across the page: green indicates positive values, red indicates negative values.
- Sentiment indicators are visual aids and should be interpreted together with absolute volumes and PnL.
- The Heatmap reflects aggregated volumes only, not PnL
- It is intended for visual prioritization, not detailed analysis
- For exact numerical values and additional metrics, use the Data table tab
- The Heatmap always corresponds to the currently selected book and filters