Dashboards
General Information
The Dashboards section allows dealers to create customized data panels with widgets displaying key trading and risk metrics.
Key Features
- Dealers can create their own dashboards, use pre-set templates, or add widgets from a built-in library.
- Each widget has adjustable settings to customize the displayed data.
- Dashboards provide real-time monitoring of key performance indicators (KPIs) related to PnL, trading volumes, quotations, and risk exposure.
- Users can import/export dashboards, customize layouts, and remove dashboards as needed.
This functionality ensures that critical trading data is easily accessible in a structured and visual format, helping dealers make informed decisions quickly.
Menu Navigation
You can find the Dashboards section under:
📌 Risk Management → Dashboards
Dashboard Templates
Brokerpilot provides pre-set dashboards that display different trading metrics.
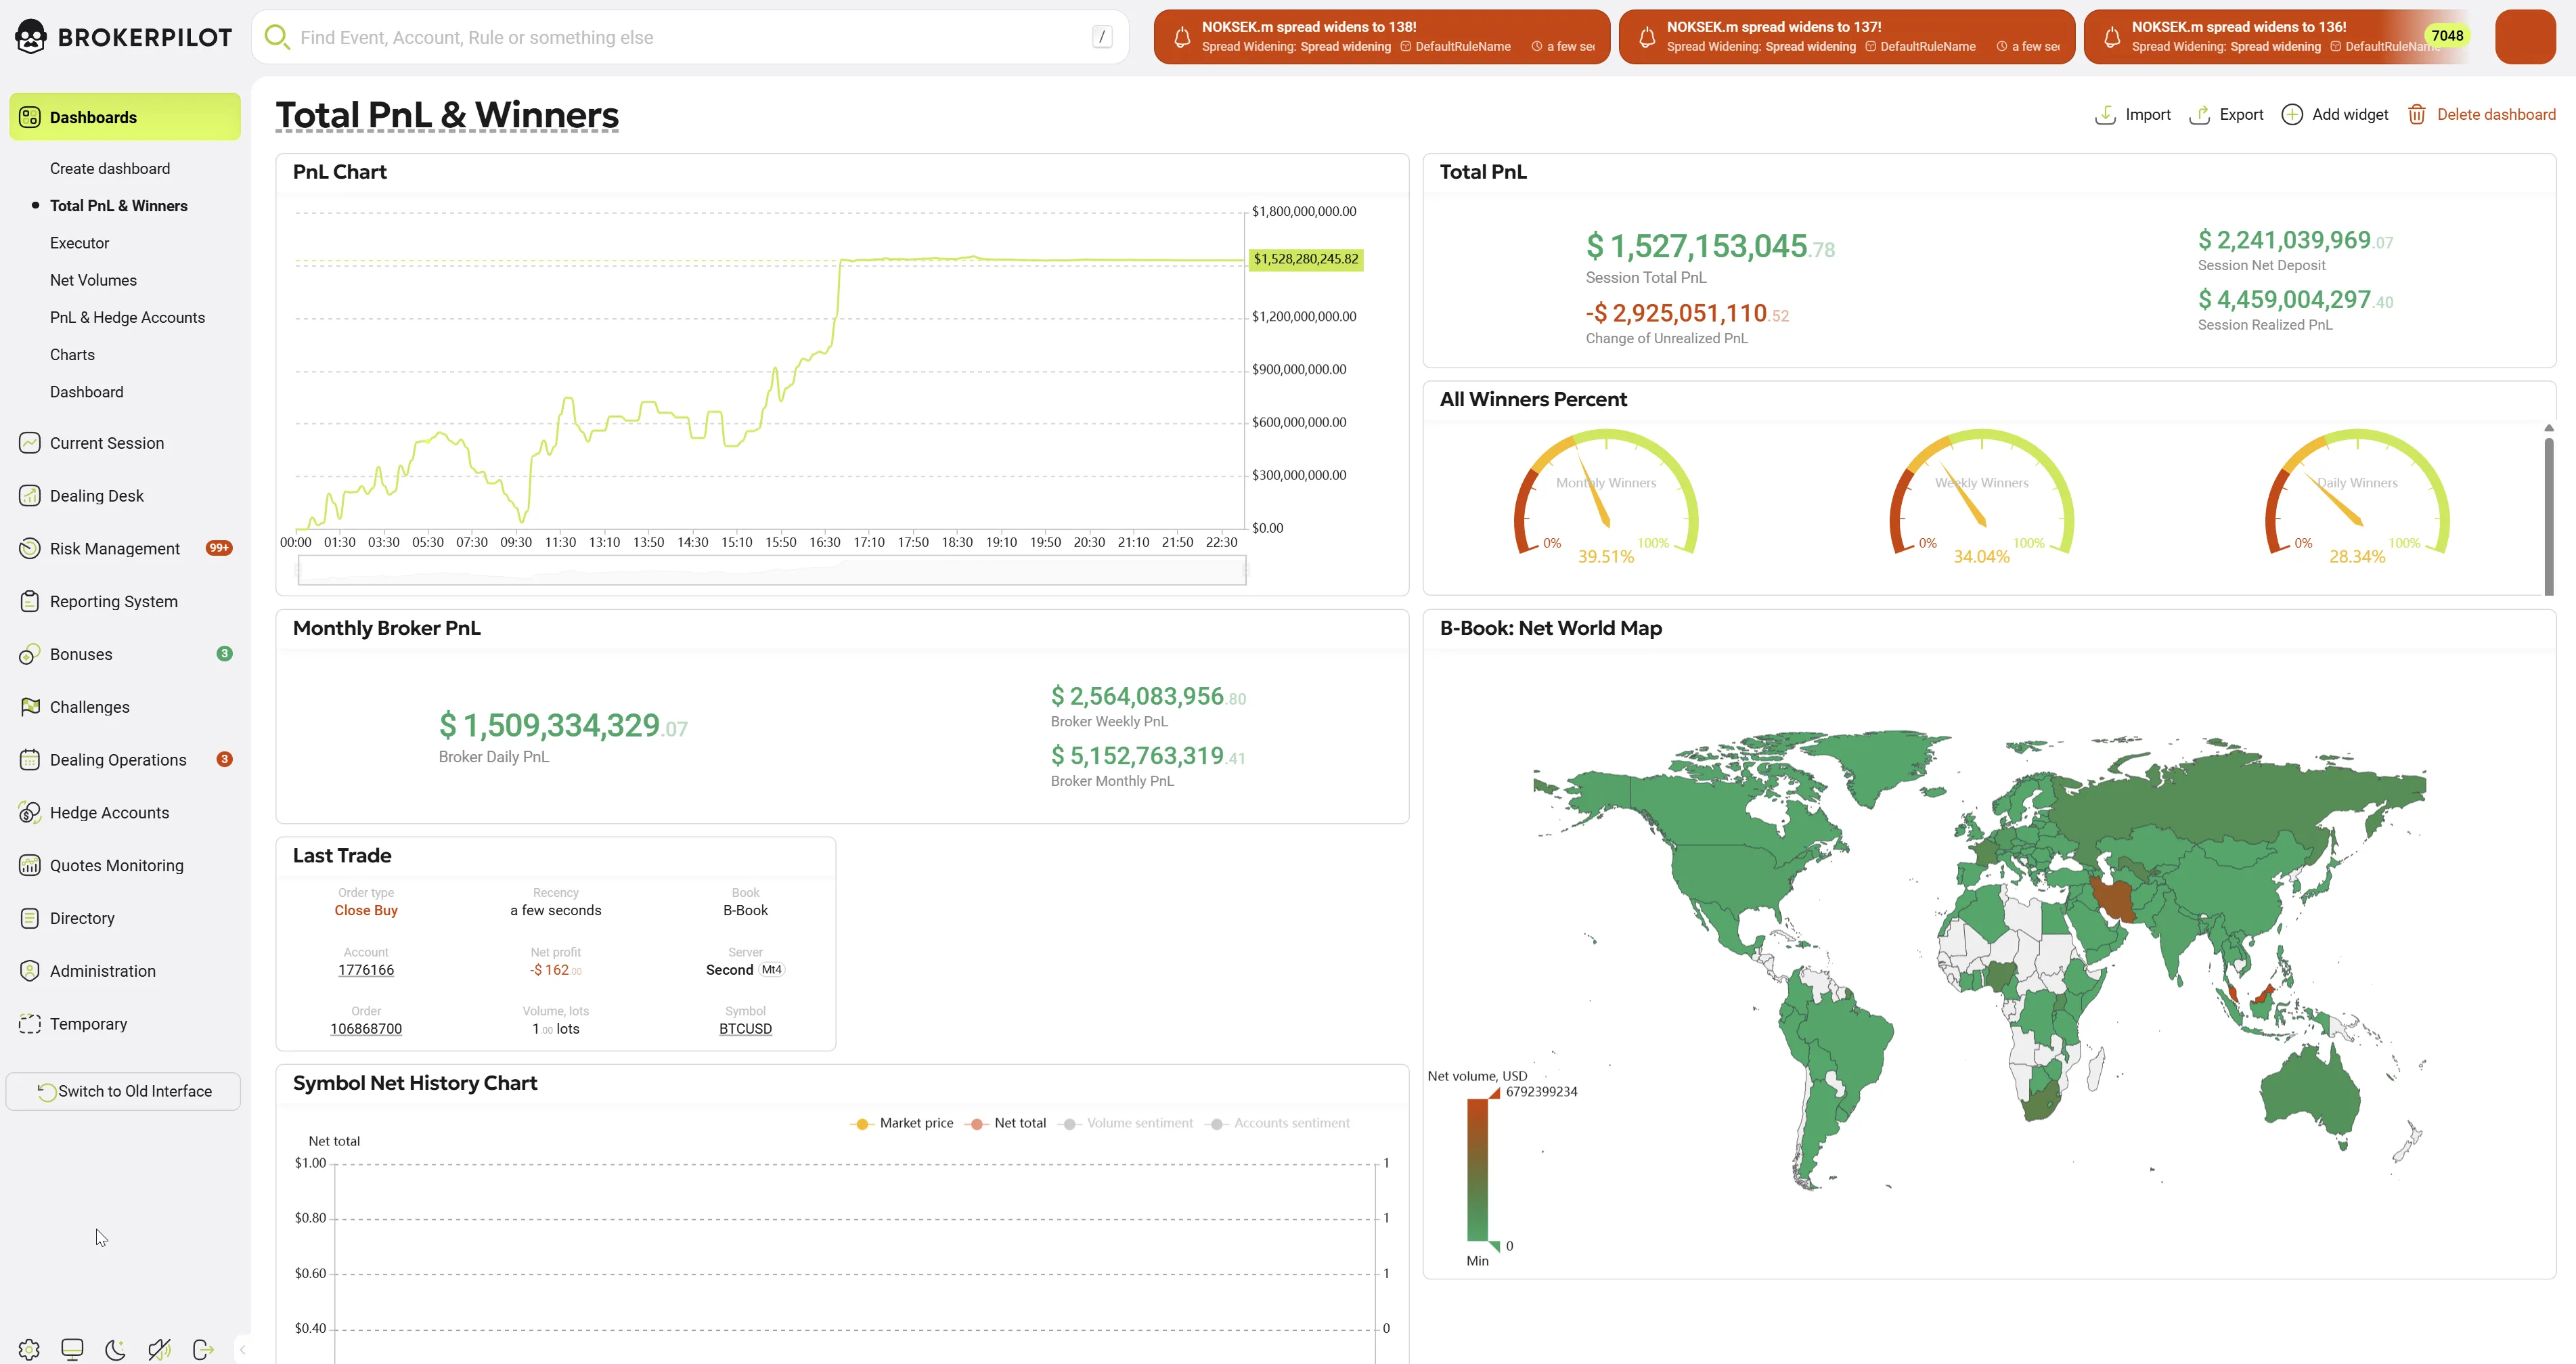
1. Total PnL & Winners (Pre-set Dashboard)
This dashboard contains six widgets displaying:
- Total Monthly PnL
- Weekly PnL
- Daily PnL
- Session PnL Chart
- Profitability of account groups
- Profitability by trade reasons
Additionally, it includes a widget showing daily, weekly, and monthly winners.
2. Dealing Streams (Pre-set Dashboard)
This dashboard displays:
- Quotation flow (price feed) on the left
- 100 last executed orders on the right
3. Big Picture (Pre-set Dashboard)
This dashboard contains five widgets that provide real-time trading insights:
- Net volumes by geolocation
- Net exposure by symbols
- Net exposure pie chart
- Last executed orders list
4. Geo Net Volumes (Pre-set Dashboard)
This dashboard contains three widgets that visualize net volumes based on:
- Traders vs. Robots
- B-Book vs. A-Book
- Overall summary of net exposure
5. Current Rates (Pre-set Dashboard)
This dashboard provides a live quotation feed for frequently traded symbols, including:
- High and low rate values
- Floating spreads
📌 Use the control panel in the top-right corner to:
- Import dashboards
- Export dashboards
- Add new widgets
- Remove dashboards
6. Executor (Pre-set Dashboard)
This dashboard displays the flow of the last executed orders from multiple trade servers.
📌 Use the control panel in the top-right corner to:
- Import dashboards
- Export dashboards
- Add new widgets
- Remove dashboards
Creating a Custom Dashboard
In addition to pre-set dashboards, dealers can create fully customized dashboards by:
- Adding widgets from the widget library
- Arranging the widget layout as needed
📌 This flexibility allows users to track only the metrics that matter to them.
Control Elements & Actions
Located in the top-right corner of the dashboard, the control panel allows users to:
| Action | Description |
|---|---|
| Import Dashboard | Upload a saved dashboard configuration. |
| Export Dashboard | Save the current dashboard layout. |
| Add Widget | Select and add widgets from the library. |
| Delete Dashboard | Remove a dashboard from the system. |
By utilizing the Dashboards feature, dealers can efficiently monitor trading performance, detect risks, and improve decision-making in real time.